The North Carolina State Climate Office has posted an update on the historic flooding from #Helene#ncwx
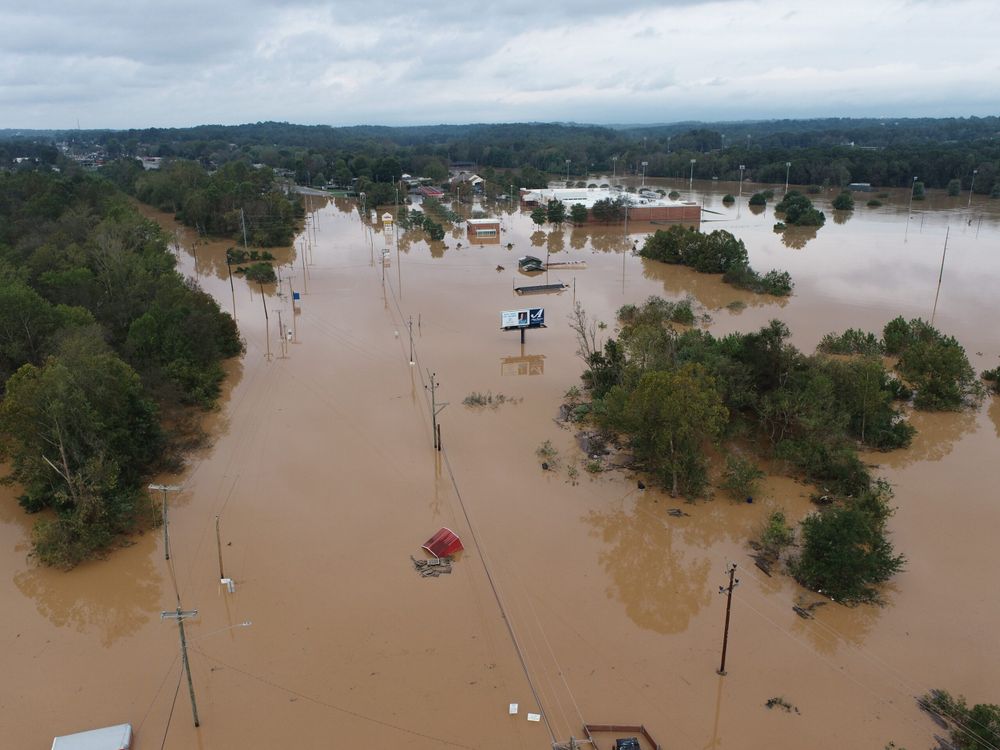
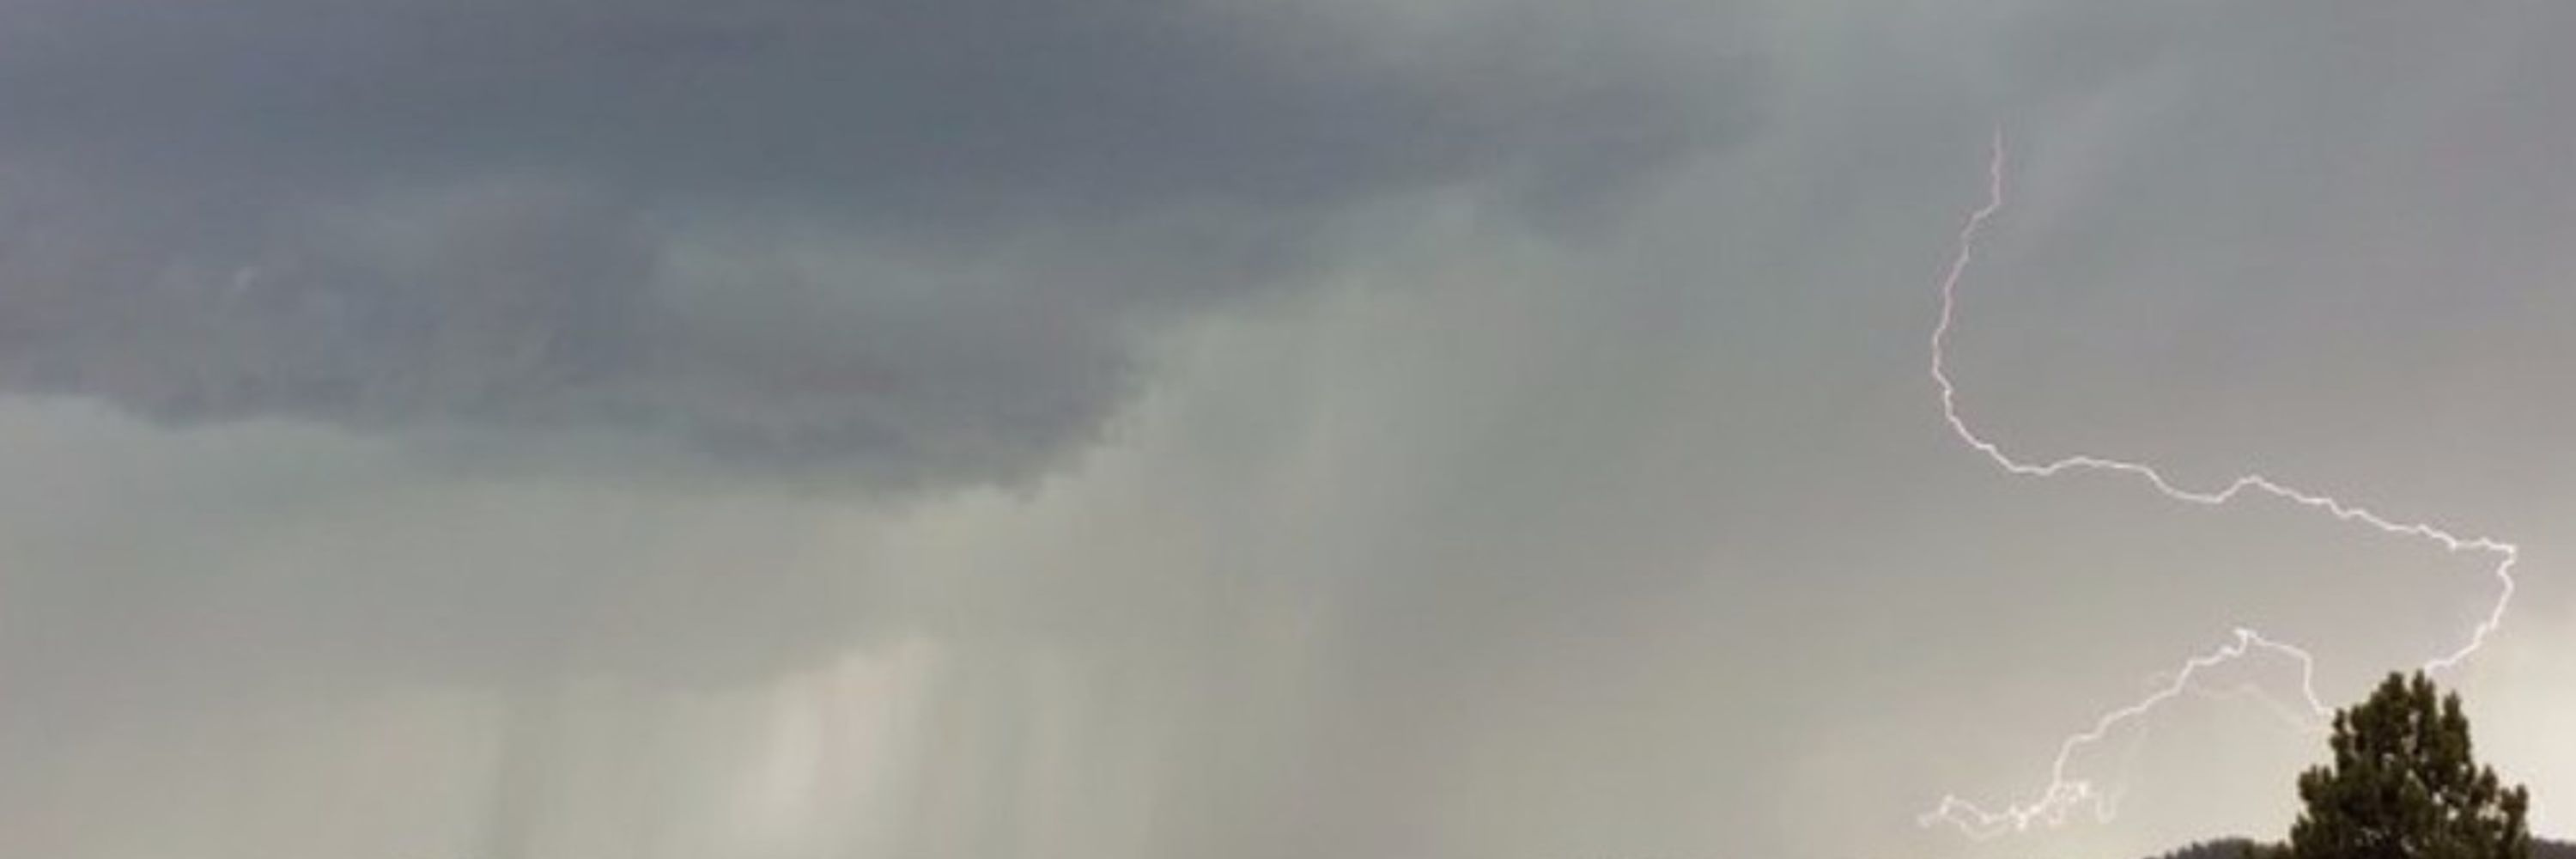
Torrential rainfall from the remnants of Hurricane Helene capped off three days of extreme, unrelenting precipitation, which left catastrophic flooding and unimaginable damage in our Mountains and sou...
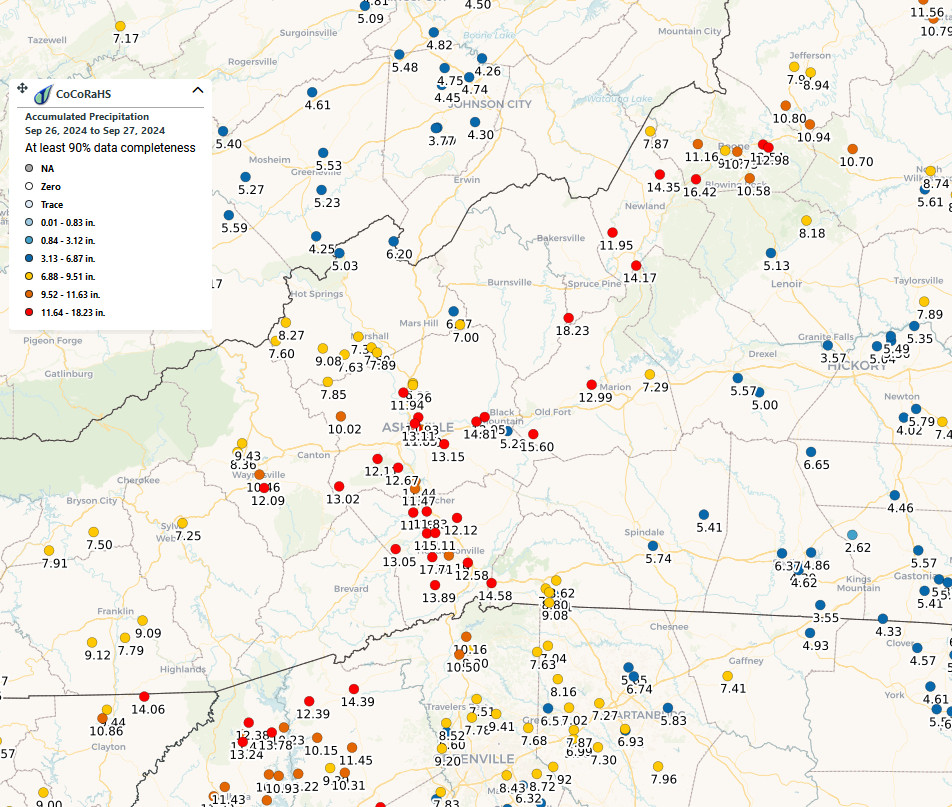
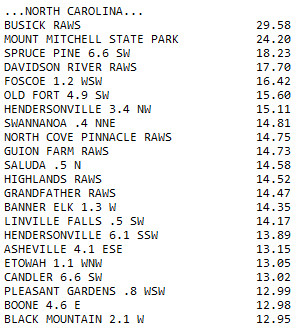
Any red dot on this map is ~12+ inches of rain over the last two days and it's likely there was much more at higher elevations. The gap in coverage northeast of Asheville is where Mt. Mitchell, highest point east of the Mississippi, is. It and nearby Busick got over 2 feet. 🌊🧪
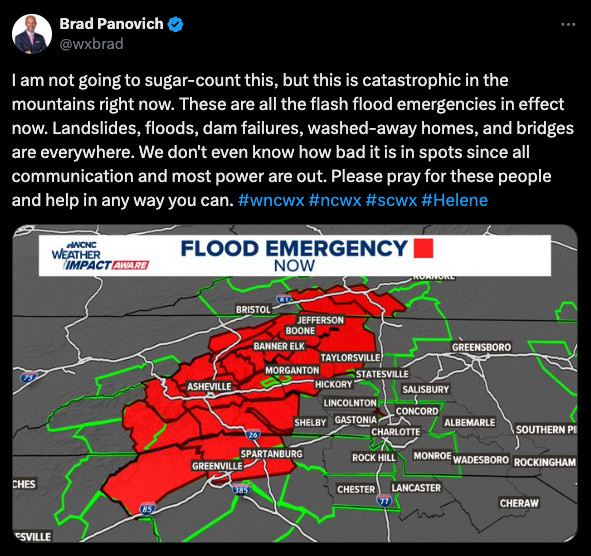
We have a very serious disaster unfolding in the Southern Appalachians right now. Multiple locations breaking record river crests by several feet. The Swannanoa River at Biltmore broke a record from 1791. Uncharted territory.
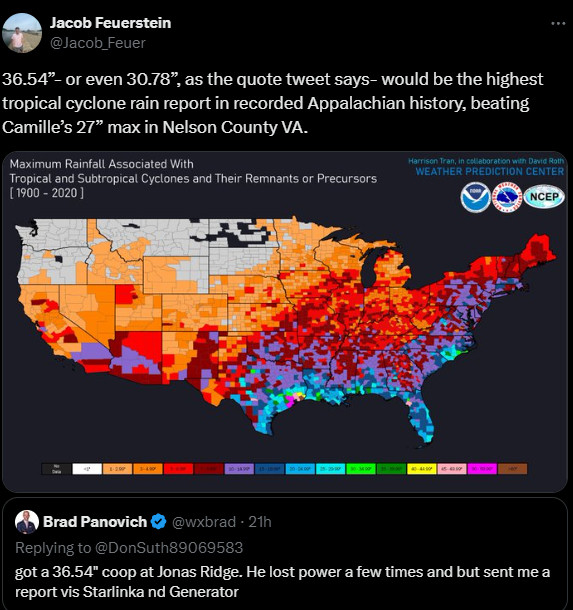
You might hear meteorologists talk about predecessor rain events (PRE). That's what the rain totals noted in the quote post below were from. If you want to learn more about PREs, check out the paper below (free access). 🧪
Parts of western North Carolina received 5+ inches *yesterday* 🌊🧪 maps.cocorahs.org
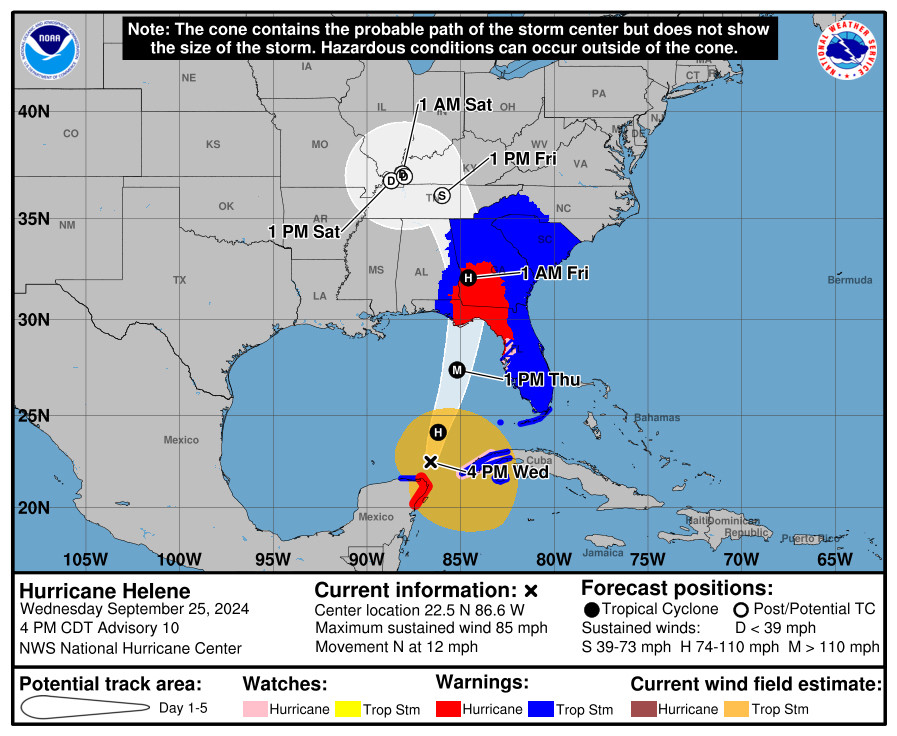
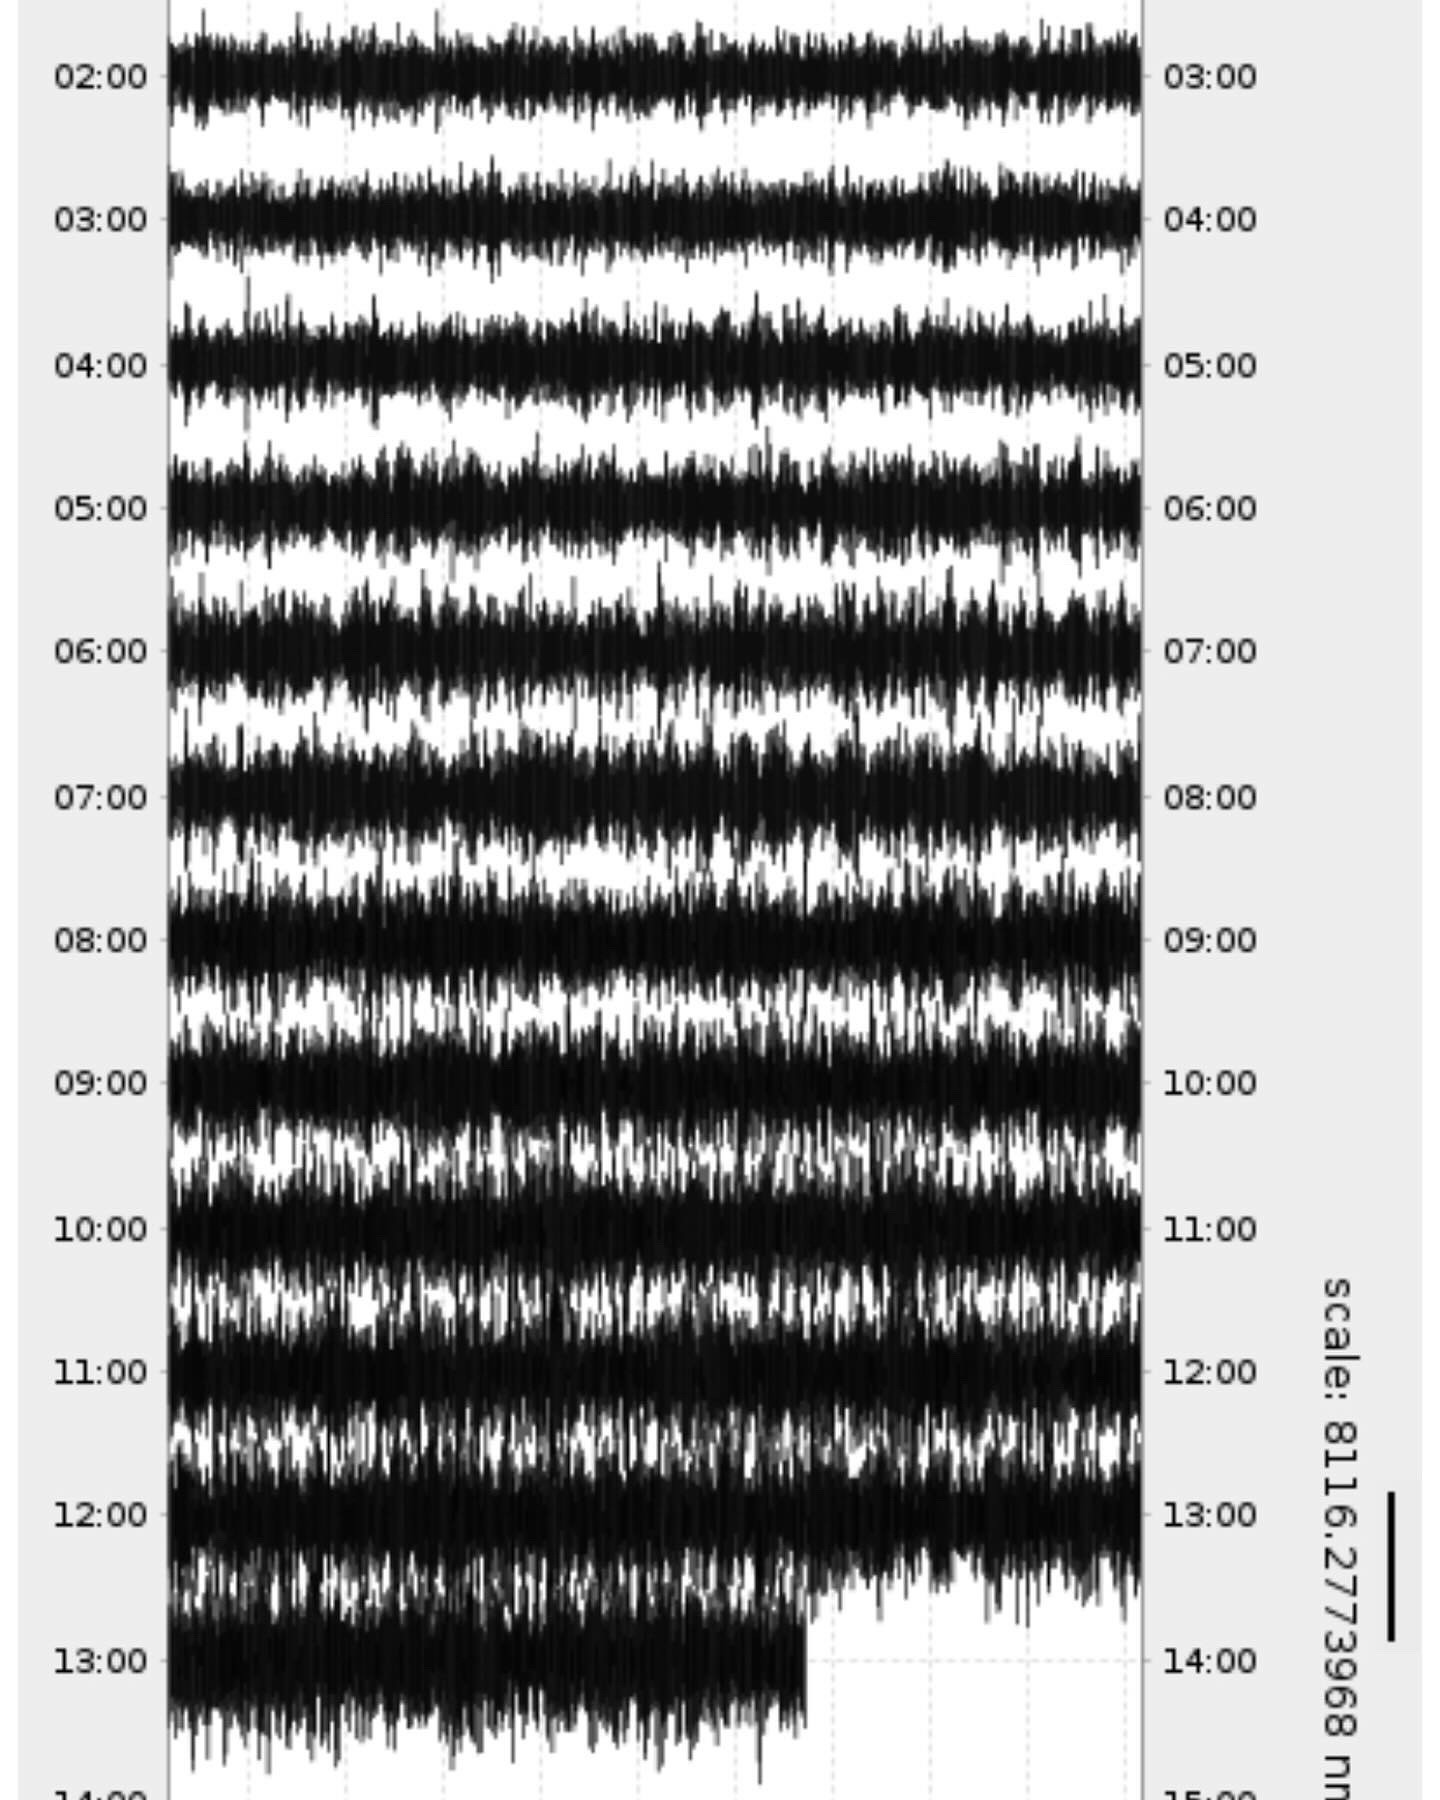
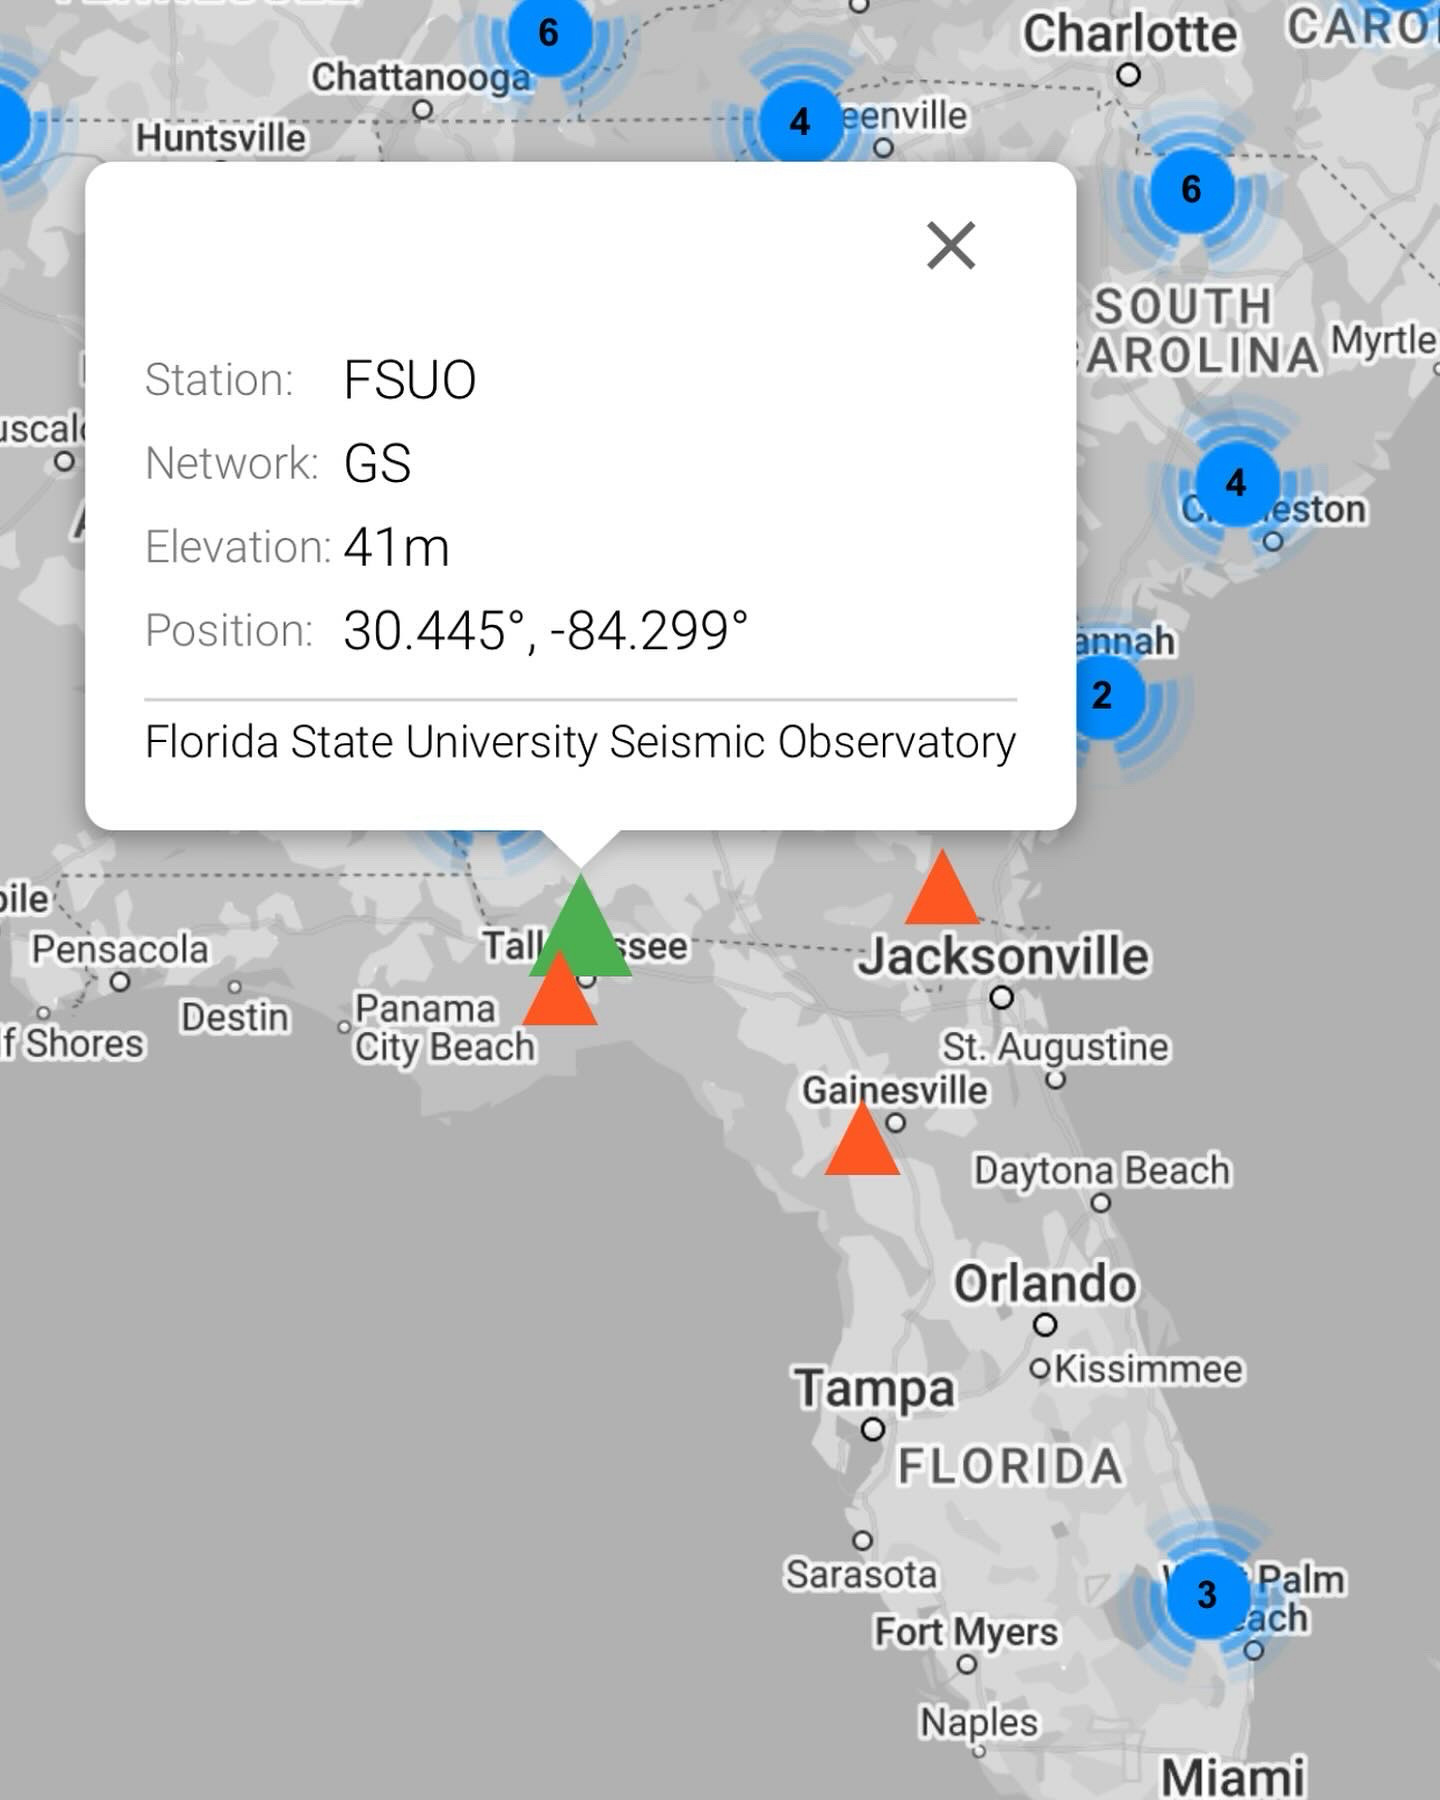
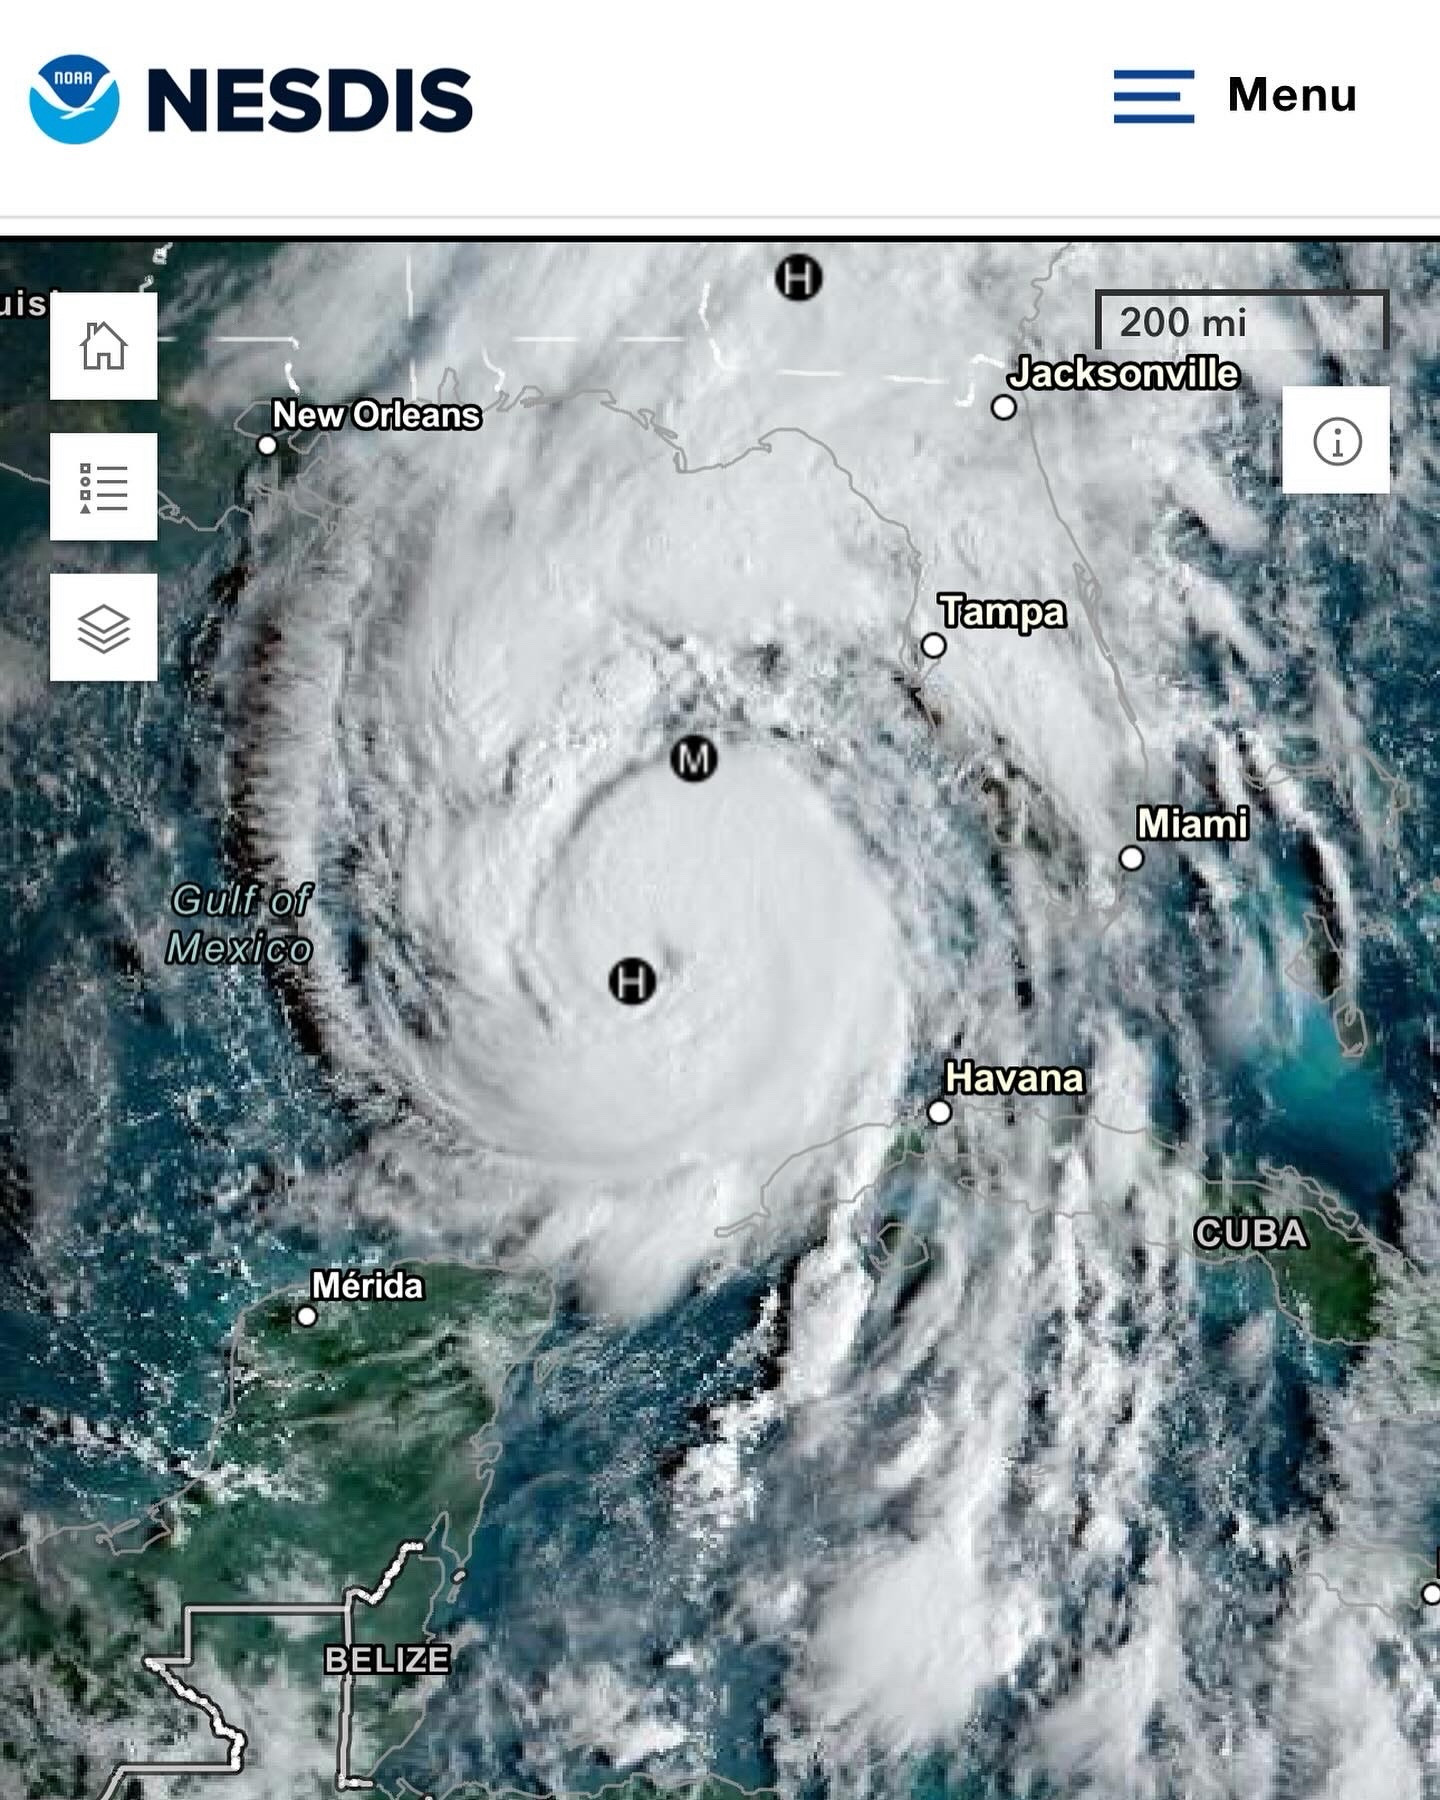
This seismic station in Tallahassee, FL is recording the approach of #HurricaneHelene. Hurricanes increase the amplitude of ocean waves, which pound on the seafloor. This produces Rayleigh waves that can be recorded 100s of miles from an approaching storm. 🧪
I mentioned on Threads that I like Bluesky and someone who had tried and abandoned it asked me why I liked it. This was my response.

👀 New public wave data from Lake Pontchartrain, LA! 🧪