South America is ablaze, with record-breaking fires burning even in typically moist ecosystems like the Amazon rainforest. Data on WRI’s Global Forest Watch platform shows that the number of fire alerts in the Amazon region are 79% higher than average for this time of year. 🌳 🔥 🧪
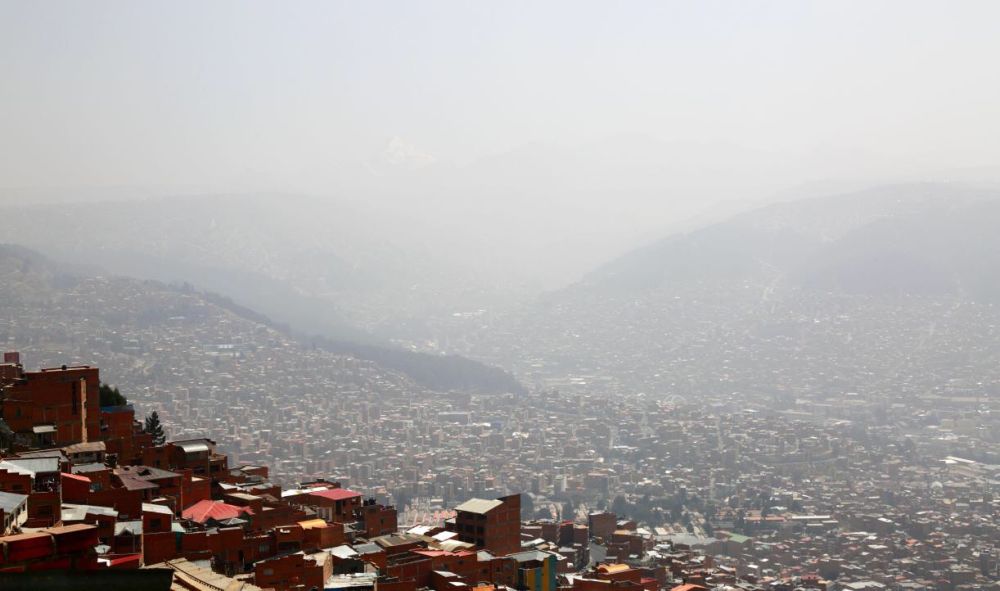
Data on WRI’s Global Forest Watch platform shows that the number of fire alerts in the Amazon region are 79% higher than average for this time of year.
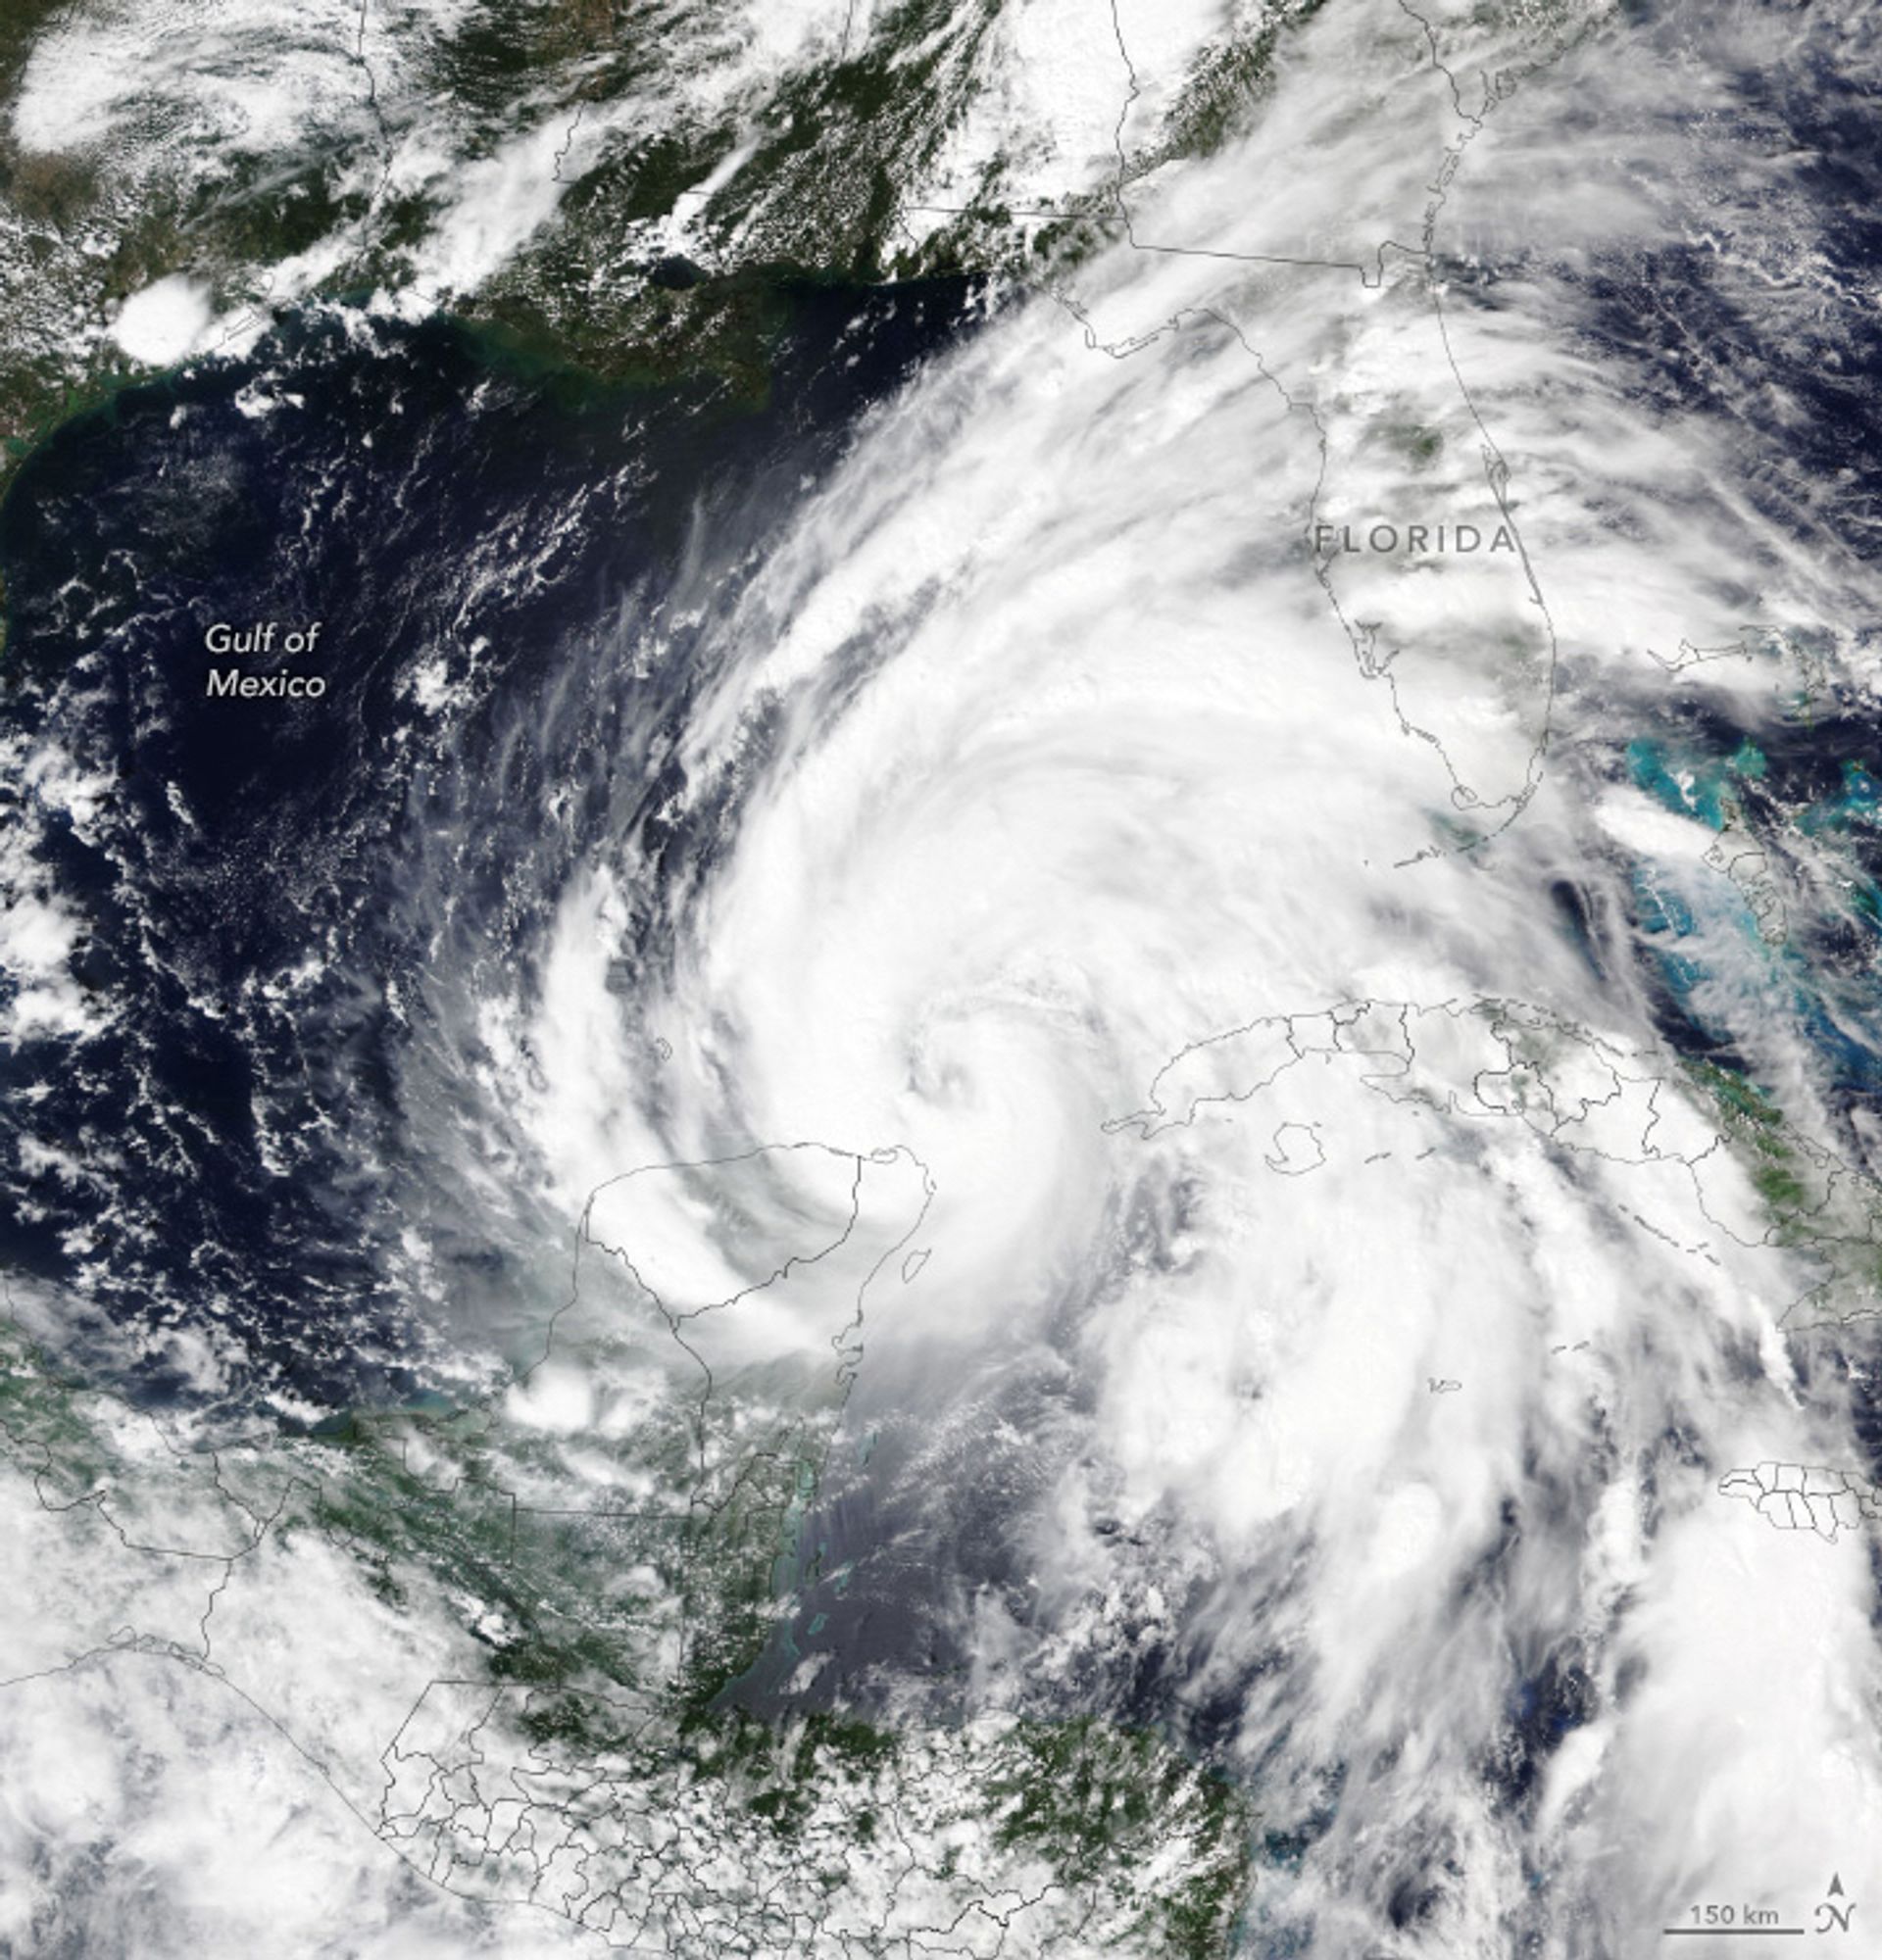
Warm water from the Loop Current helped fuel #Helene#Florida’searthobservatory.nasa.gov/images/15337...

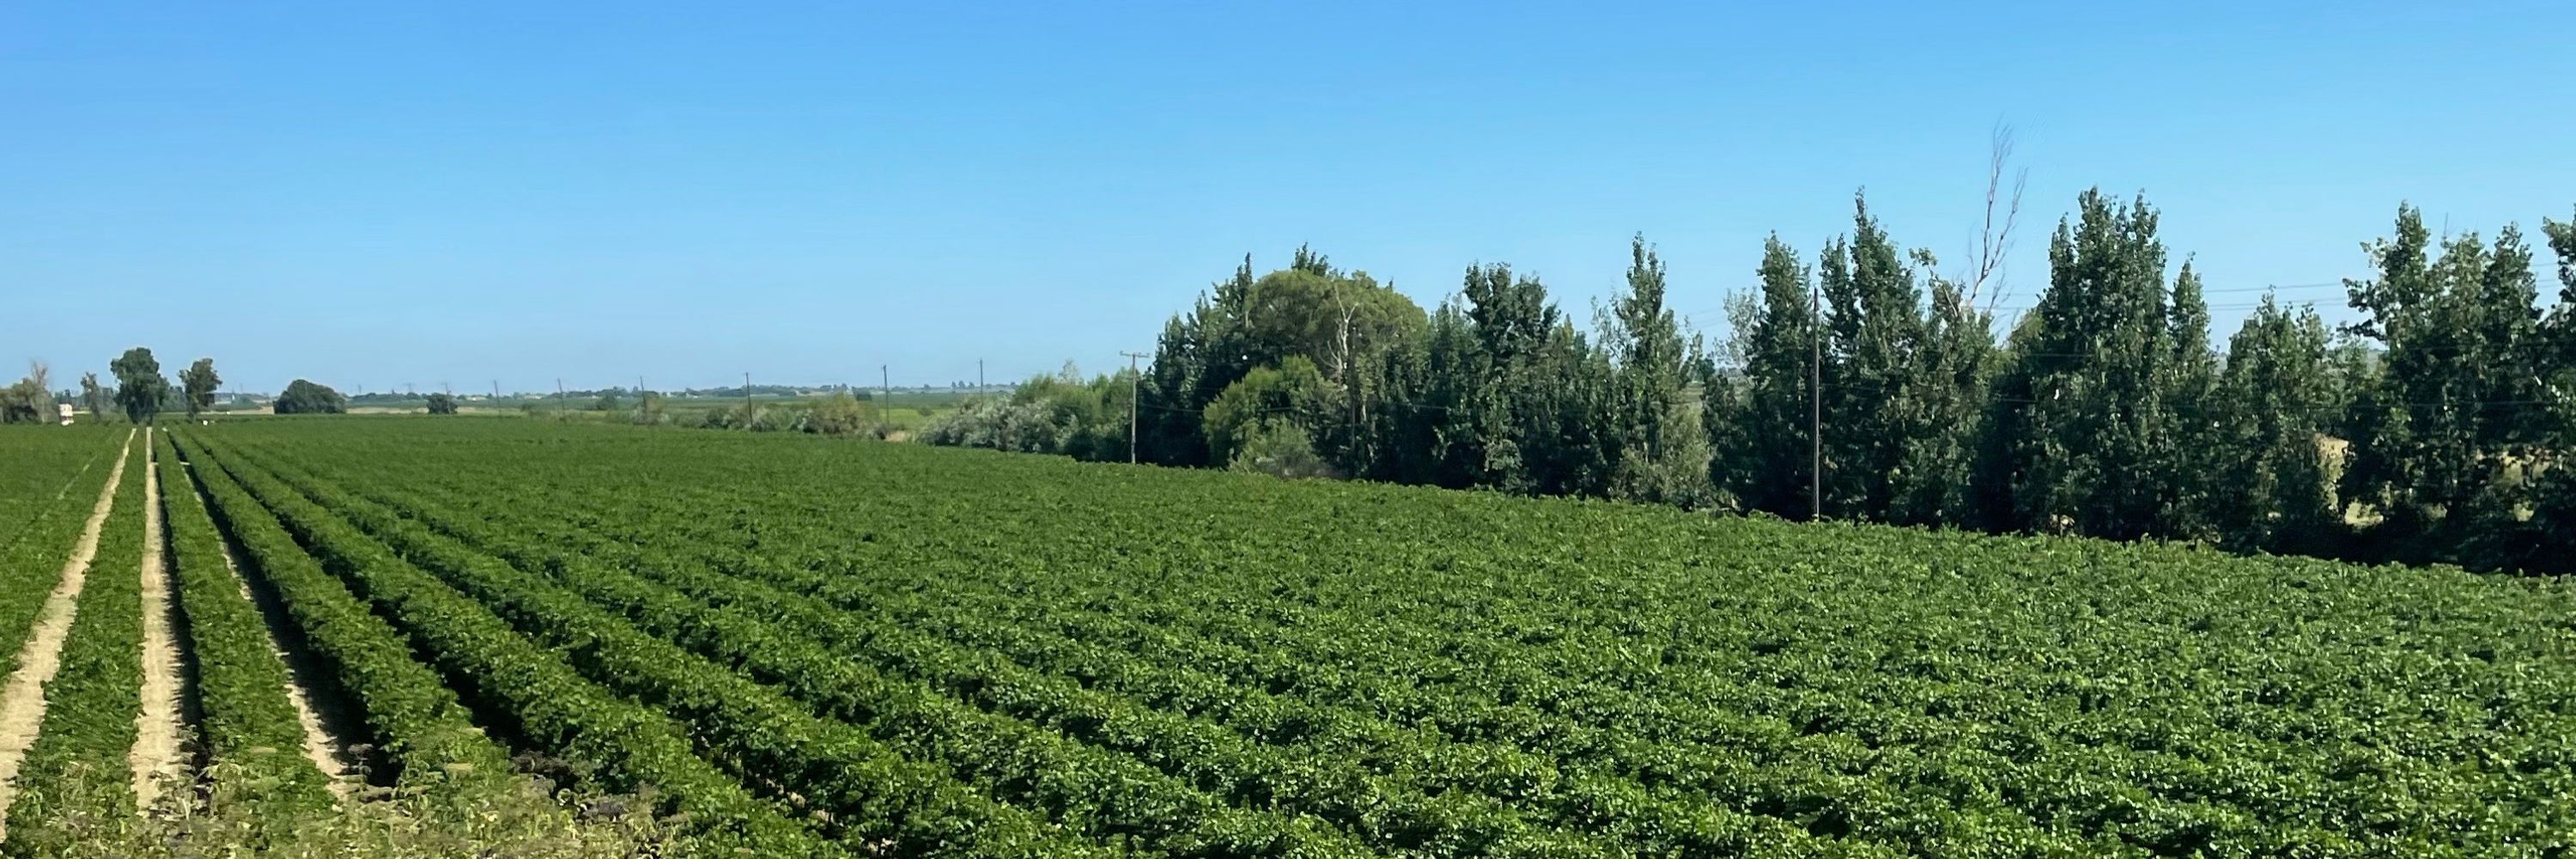
Global crop mapping got a major update earlier this year, when IFPRI and Land & Carbon Lab produced a map for the year 2020 showing crop areas and yields for 46 different crops globally. Read more and explore the maps here: 🧪 #FoodStudies
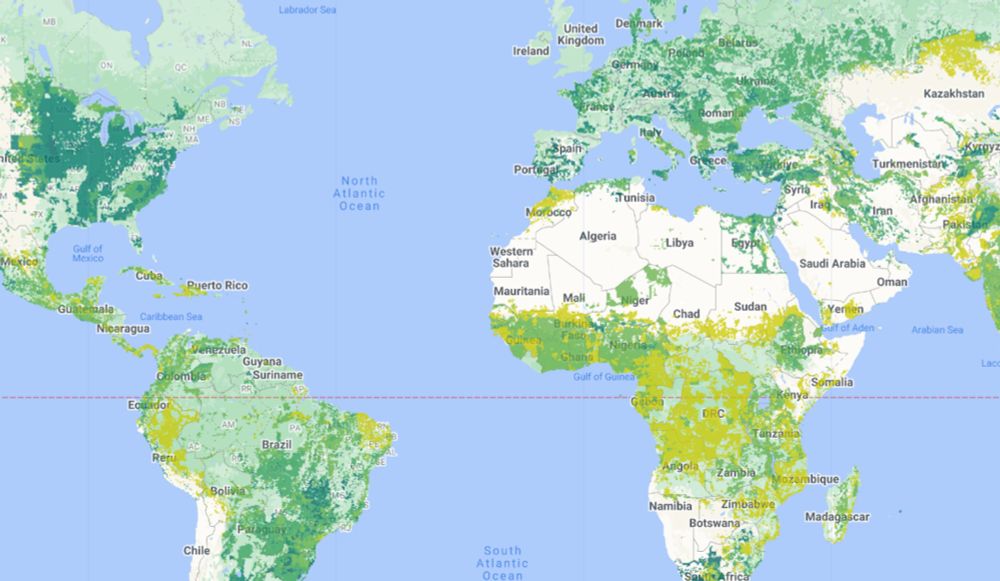
An updated model called SPAM produces global maps of crop areas and yields that are pivotal for sustainable supply chains and food security.
Yes, and the World Resources Institute and others are tracking these benevolent cascades here: systemschangelab.org
Systems Change Lab monitors, learns from and mobilizes action toward the transformational shifts needed to protect both people and the planet.
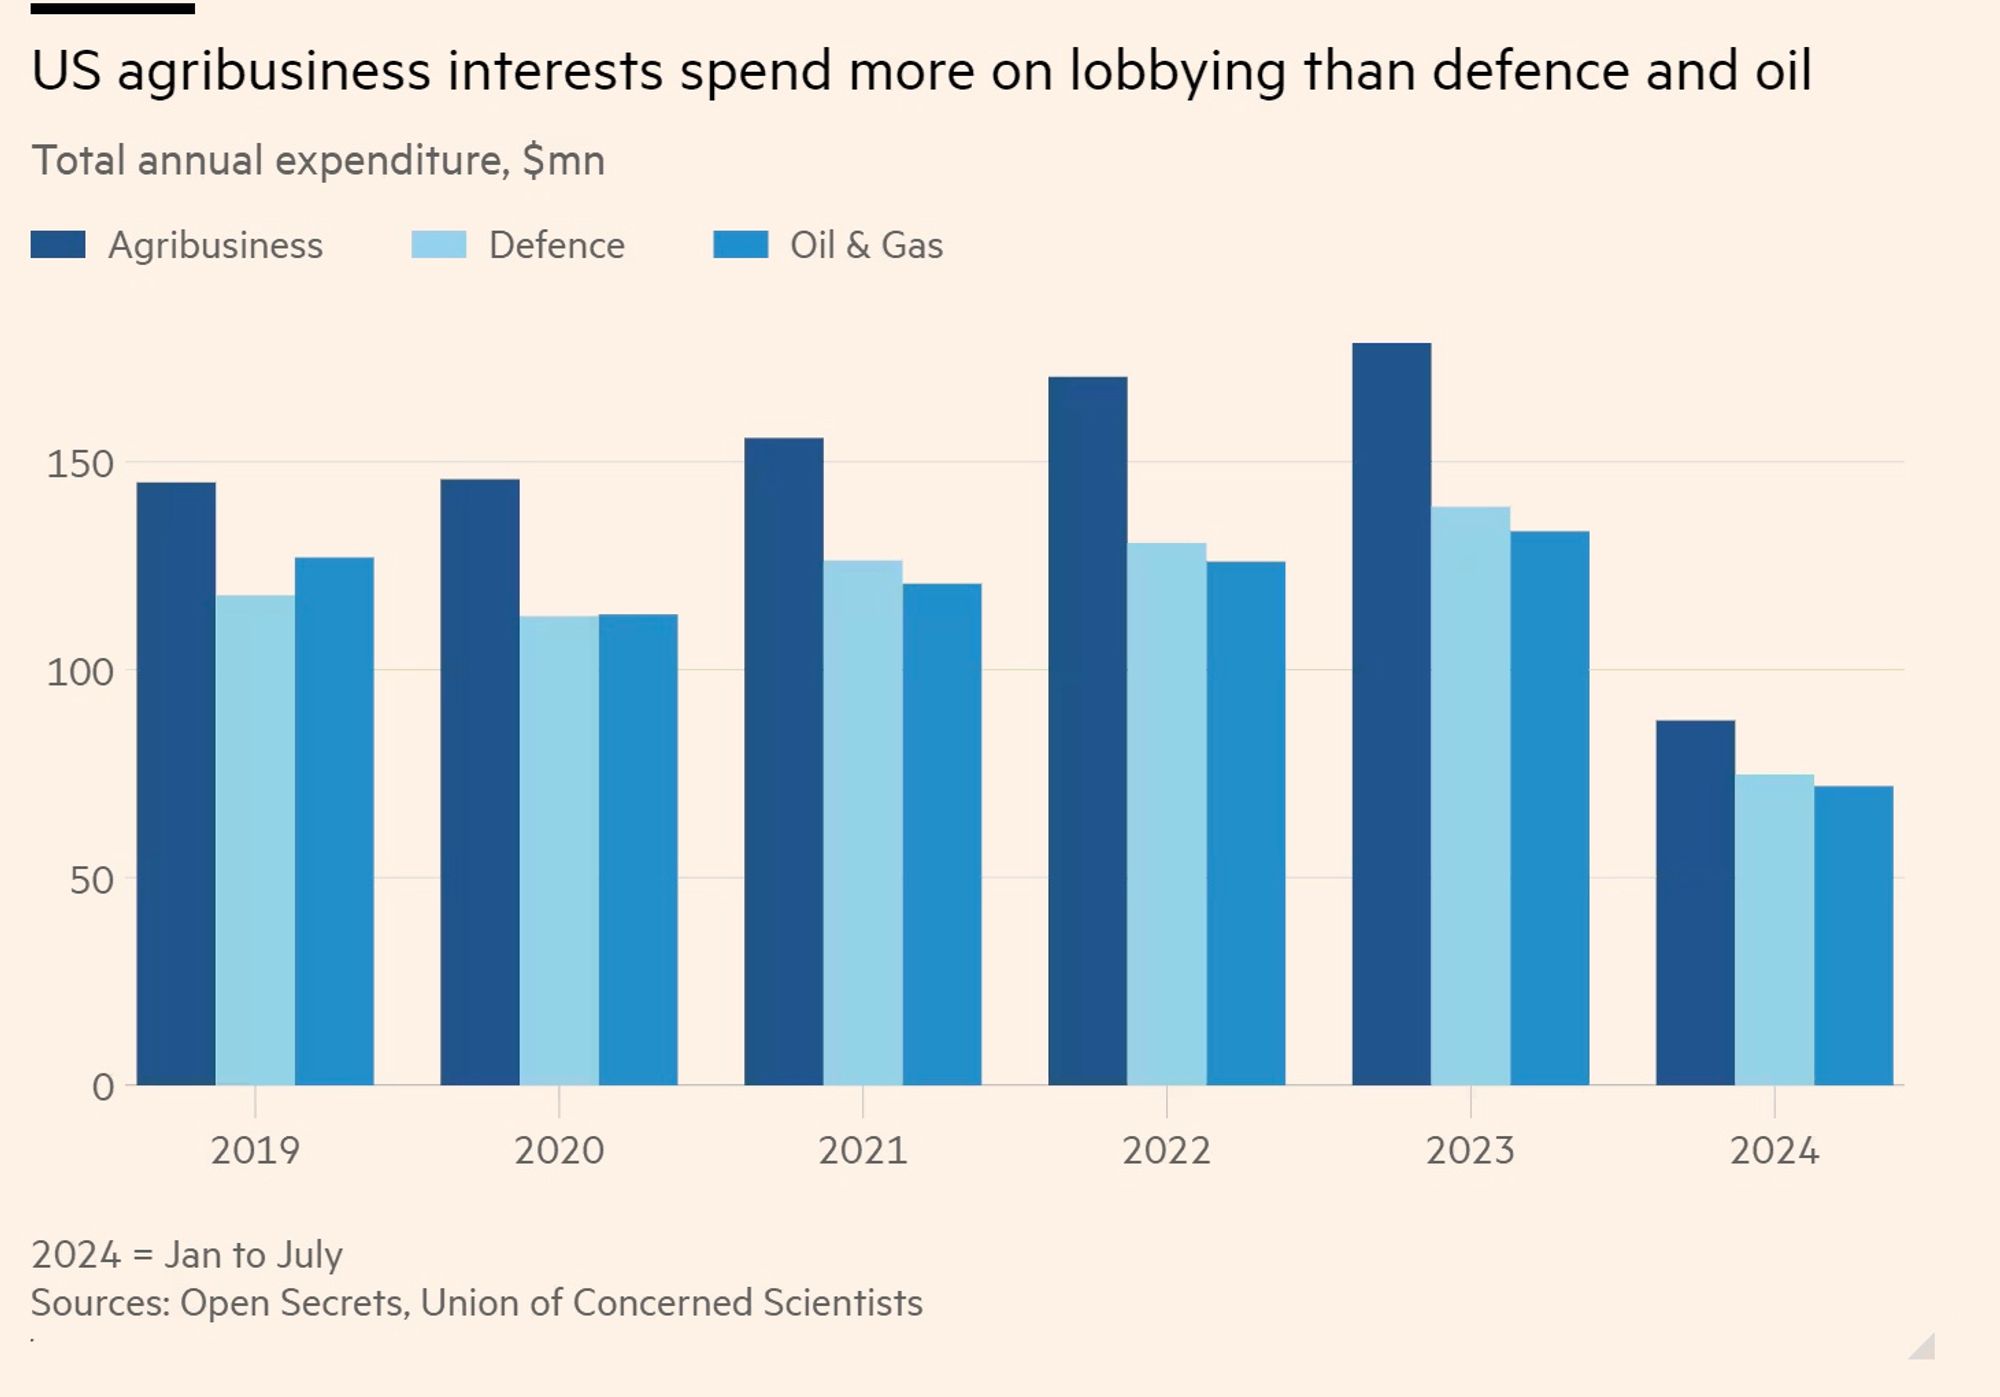
If you think “Big Oil” has a hold on Washington, have you met “Big Ag”?
This week we are touching base with @NASAGoddard's PACE! It stands for Plankton, Aerosol, Cloud, ocean Ecosystem, but if you want to learn more than that, you've got to listen to our new episode 👉 linktr.ee/WeatherGeeks

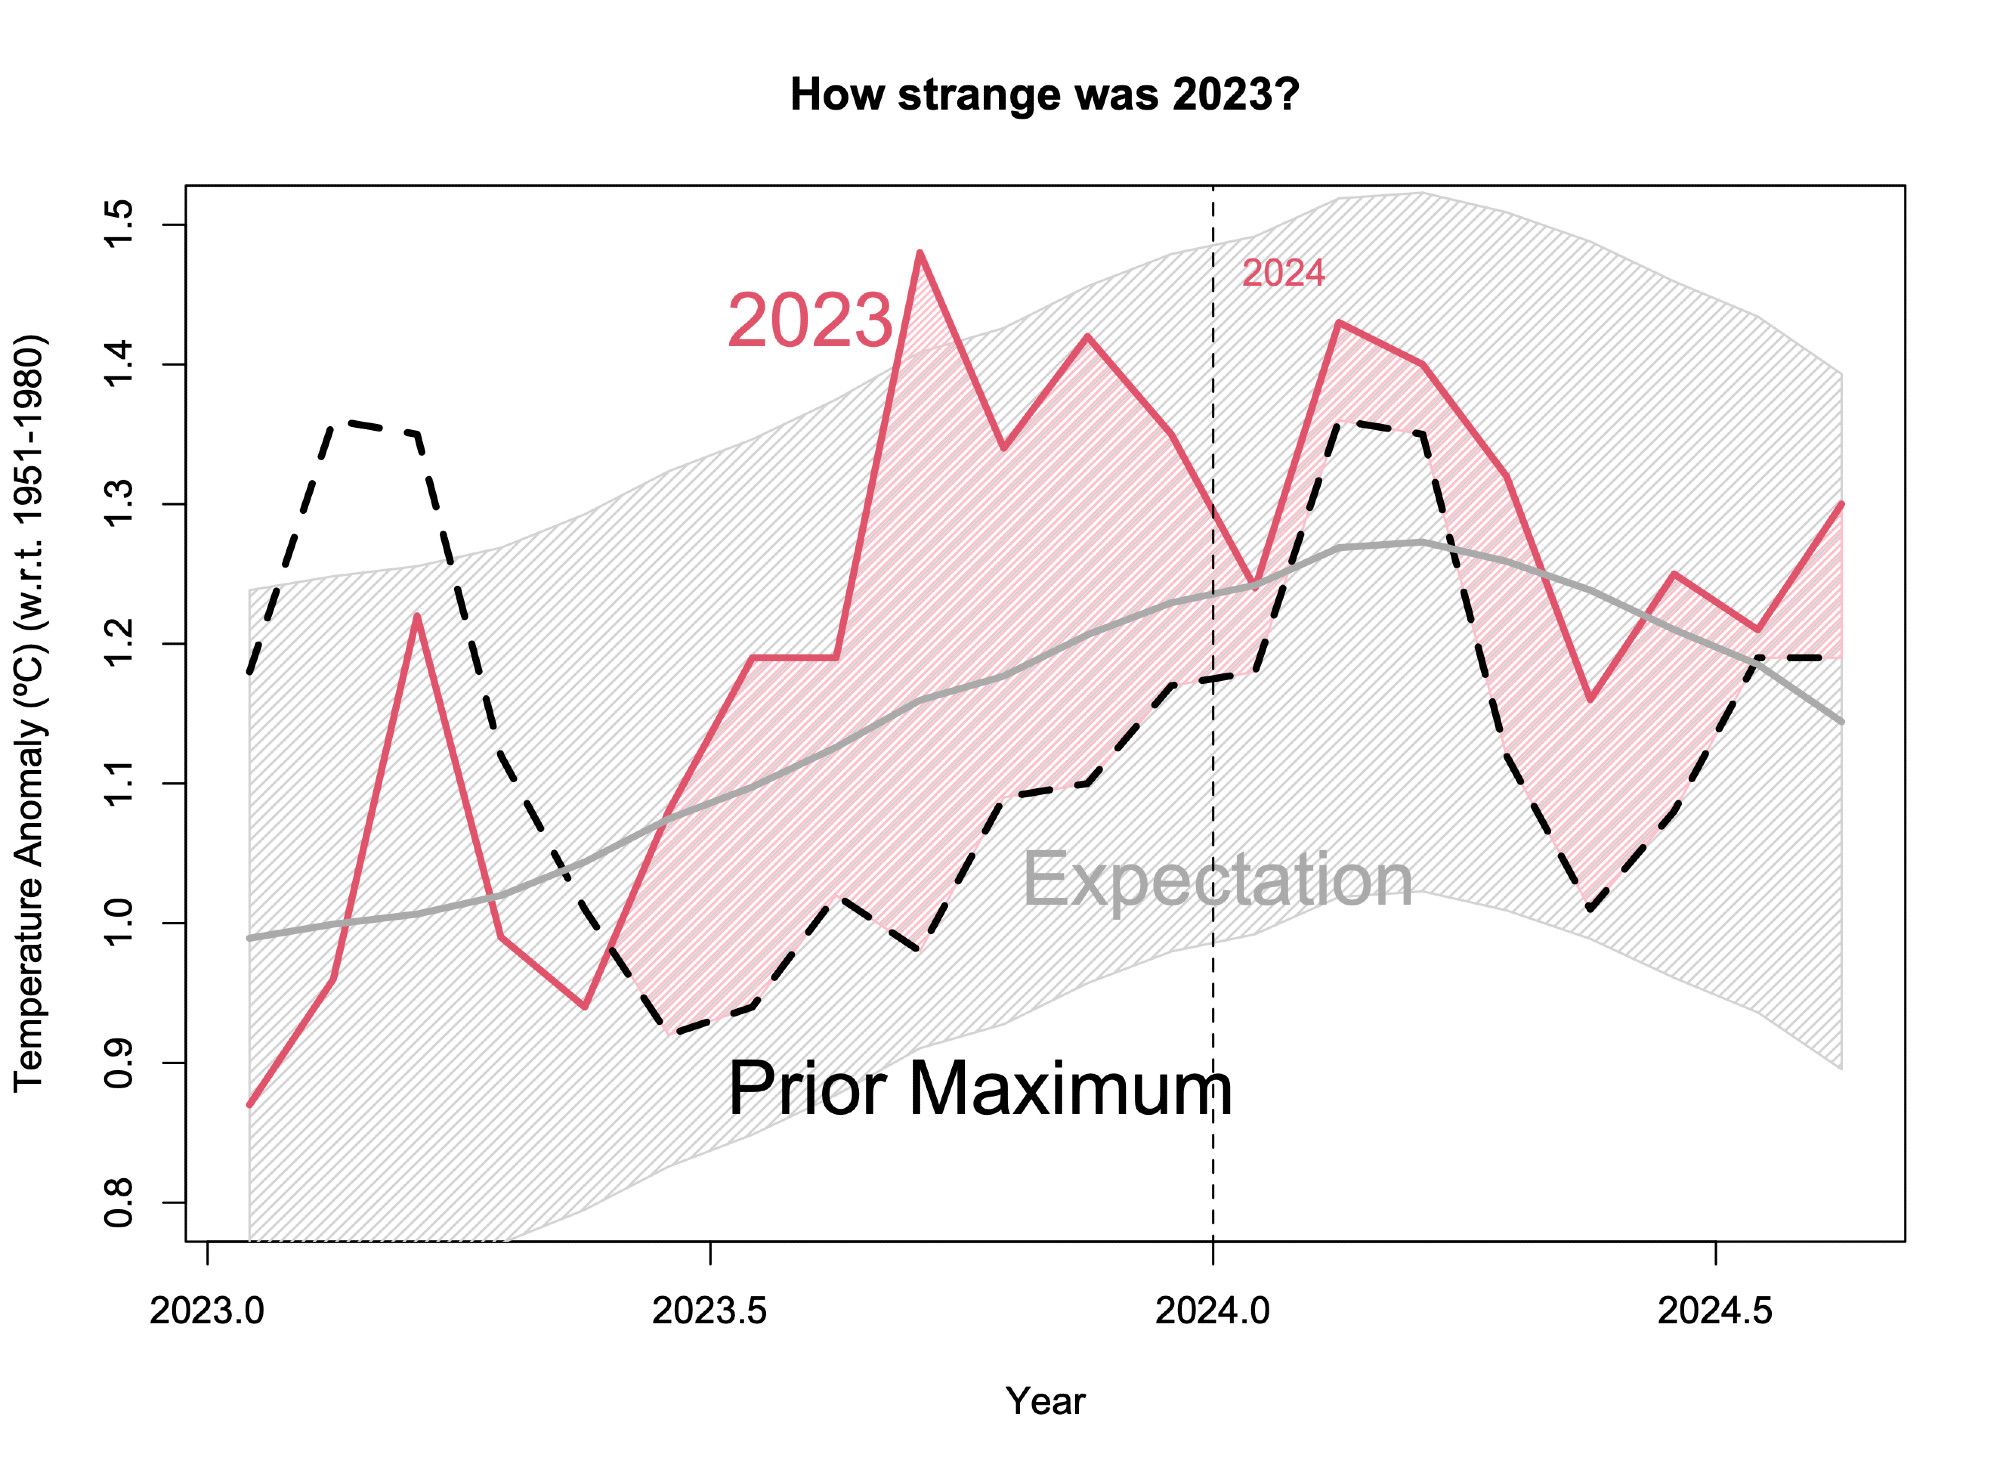
Some updated figures now that the August temperatures have been posted. First, how are things going w.r.t. expectations? 2024 is still somewhat consistent with an ENSO response, but the August anomaly is pushing it.