This might come as a surprise to some, but cold extremes do in fact decrease under global warming. Decade-old errors in data analysis finally get fixed. www.realclimate.org/index.php/ar...

The title of this post might seem like a truism, but for about a decade some people have claimed the opposite, and many people have spent much time and effort trying to understand why. Much of that ef...
New paper on something near to my science heart – and still a bit of a blind spot in society: *Including internal climate variability in risk assessment* We use the CESM2 Large Ensemble to stress-test renewable energy in the Western U.S. agupubs.onlinelibrary.wiley.com/doi/10.1029/... 🧵 1/9
We identify a decarbonization pathway for the power system that is robust to future climate realizations Our framework is extensible to long-term planning by utilities, regions, and regulators L...
Models and observations agree on fewer and milder midlatitude cold extremes even over recent decades of rapid Arctic warming – Blackport et al. doi.org/10.1126/scia... "The previously reported increase in cold extremes was overestimated due to an artifact of changing data coverage"
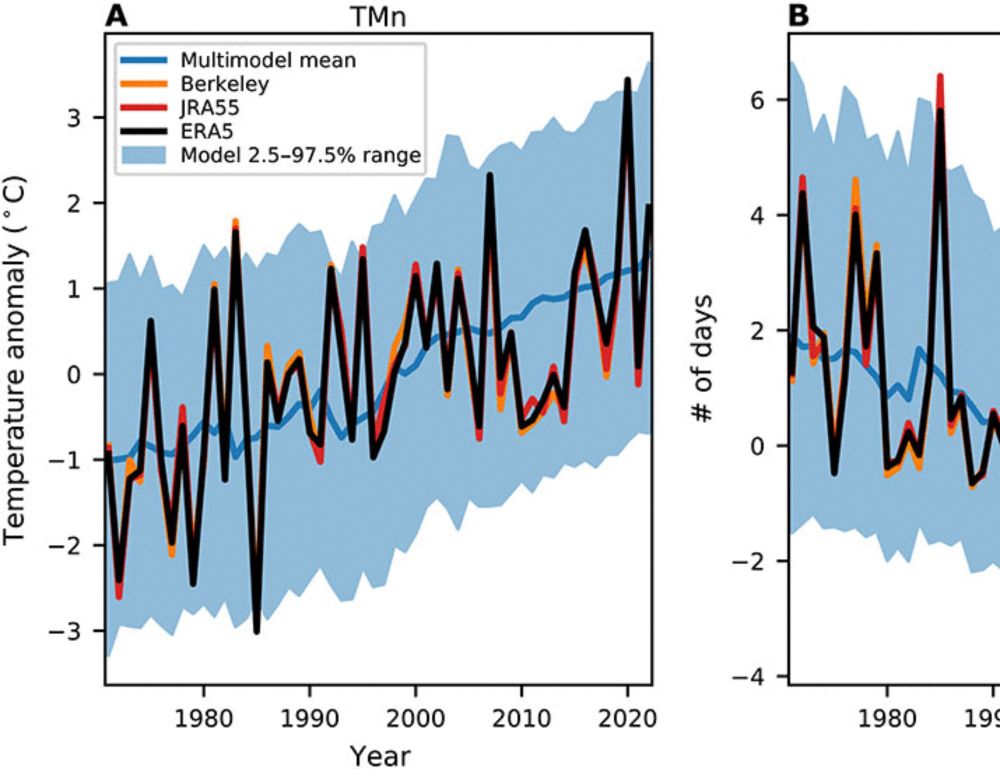
Midlatitude extreme cold events have decreased in severity and frequency over recent decades, in agreement with models.
Not an expert on this topic, but density of development in floodplains must matter. If concrete residential areas are separated by large drainage areas (lakes, reservoirs, ...), flood impacts will be reduced. E.g., recent flooding in Bengaluru—concrete jungles flood more easily than real jungles.
That is also my opinion (especially in the global average sense). There's also a related question: Can climate tipping points be usefully and precisely predicted? I don't think they can be (even with additional research). Not saying we can rule out tipping points; they may lurk in our blurry future
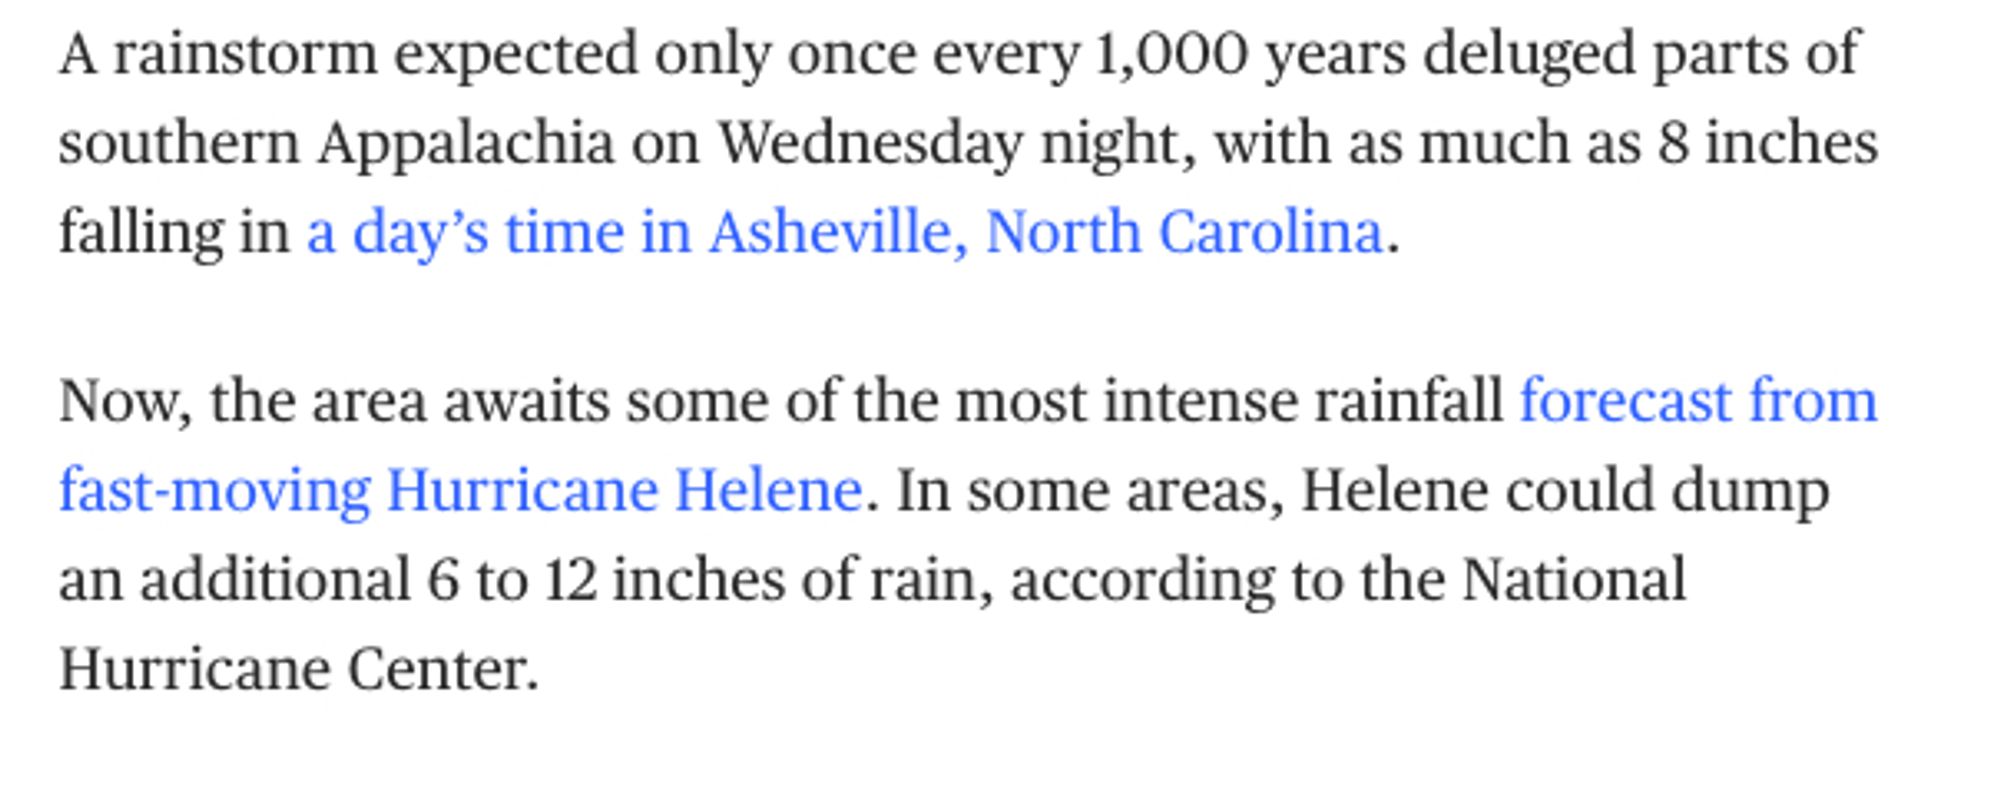
We're seeing news of 1 in a 1000 year rainfall events, and of rivers reaching record height from Helene For a while, something has worried me about estimates of flood and precipitation return levels in the South and Southeast US, and (for once) it's not climate change. 1/

The way I like to think about it mathematically is that the CO2 system is nonlinear for large changes and long timescales. But for small changes on short time scales, any nonlinear function is locally linear (tangent linear approximation) and therefore responds symmetrically to +/- small changes.
How nerdy are we trying to get on Bsky? I am discovering that people fit heavy-tailed distributions (e.g. Gamma) to gridded datasets to estimate likelihood and return times of extreme events 😬 www.drought.gov/data-maps-to... standardized-precipitation-index-spi-nclimgrid-monthly This is risky 1/
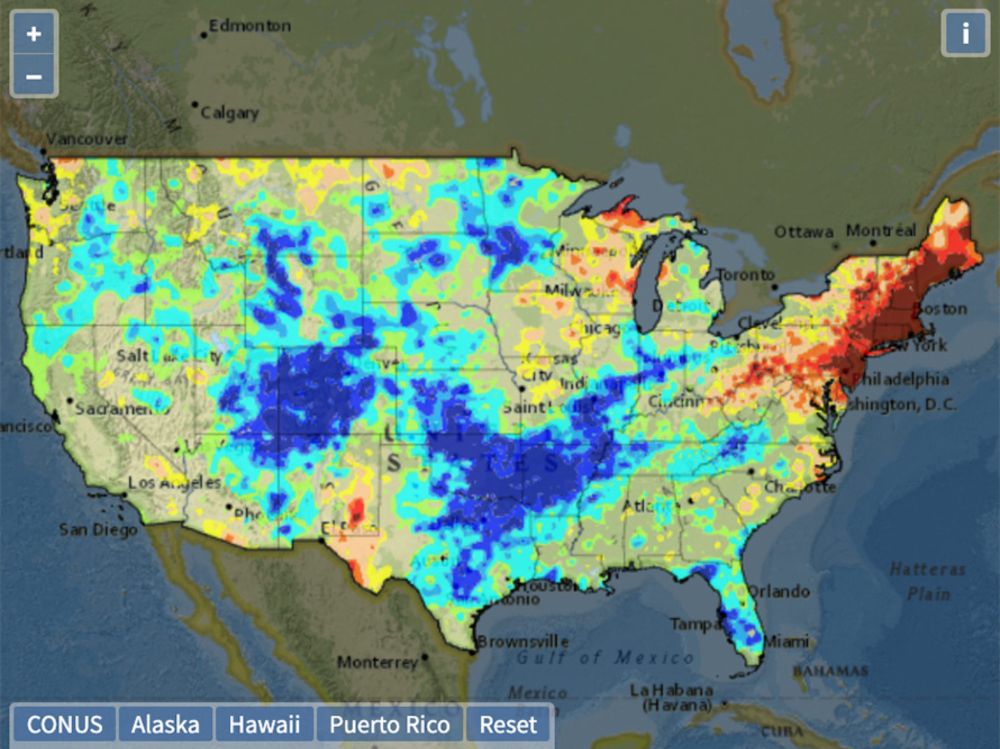
The US Gridded Standardized Precipitation Index (SPI) is derived from the nClimGrid-Monthly dataset and includes timescales of 1, 2, 3, 6, 9, 12, 24, 36, 48, 60 and 72 months.
Texas A&M Dept. of Atmospheric Sciences is hiring. Noted areas are Boundary Layer Meteorology, Urban Meteorology, or Fire Weather, but excellent candidates in other areas will be considered. apply.interfolio.com...

I introduce this concept using Sankey diagrams for energy consumption. They are shocked when they figure out what "rejected energy" is & it's percentage. This information is new to virtually all of the students in my class. The same is true when I talk to the community. flowcharts.llnl.gov