BLUE
TK
Tal Korem
@tkorem.bsky.social
Microbiome, network inference, metabolism and reproductive health. All views are mine.
239 followers159 following51 posts
TKtkorem.bsky.social

Just told my partner yesterday that even if I had another two weeks between Saturday and Sunday I would still be late on a few deadlines come Monday

1
TKtkorem.bsky.social

ืืชื” ื™ื›ื•ืœ ืœื”ืจื—ื™ื‘?

1
TKtkorem.bsky.social

Importantly - we'd love to hear your comments, feedback, and GitHub issues! In particular if thereโ€™s additional prior work on this topic that we should note.

0
TKtkorem.bsky.social

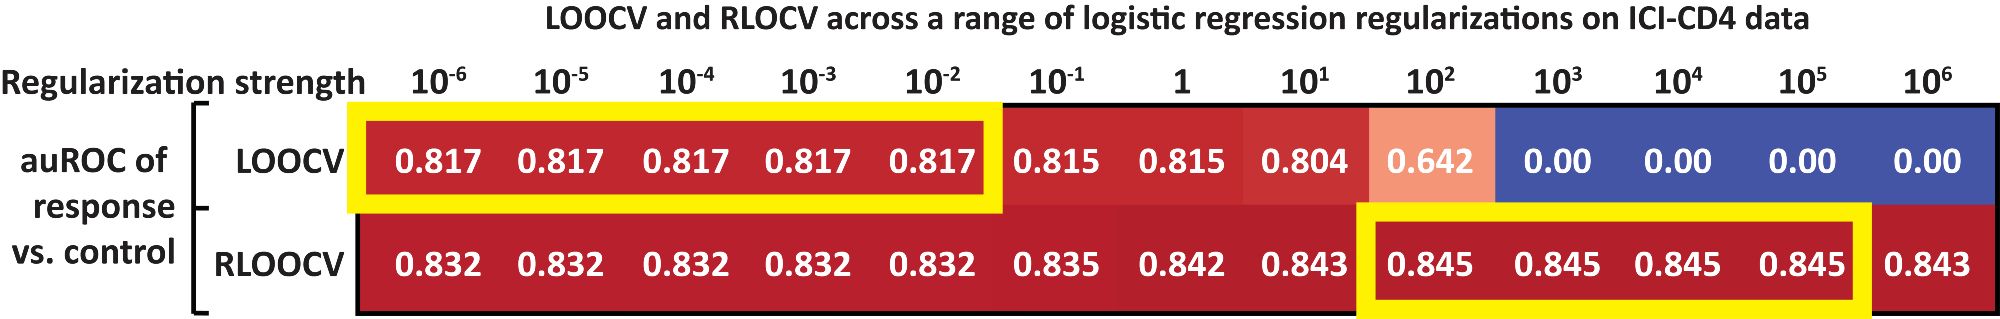
But CV is used not just for evaluation but also for hyperparameter tuning, and distributional bias impacts HPs that affect regression to the mean. For example, we show that it biases for weaker model regularization, which might affect generalization and downstream deployment.

A comparison of LOOCV and Rebalanced LOOCV evaluation of logistic regression models with varying regularization strength on one of the evaluations analyzed above. LOOCV has the best auROC (of 0.817) with weak regularization (1e-6 - 1e-2) while Rebalanced LOOCV has the best auROC (of 0.845) with strong regularization (100 - 1e5).
1
TKtkorem.bsky.social

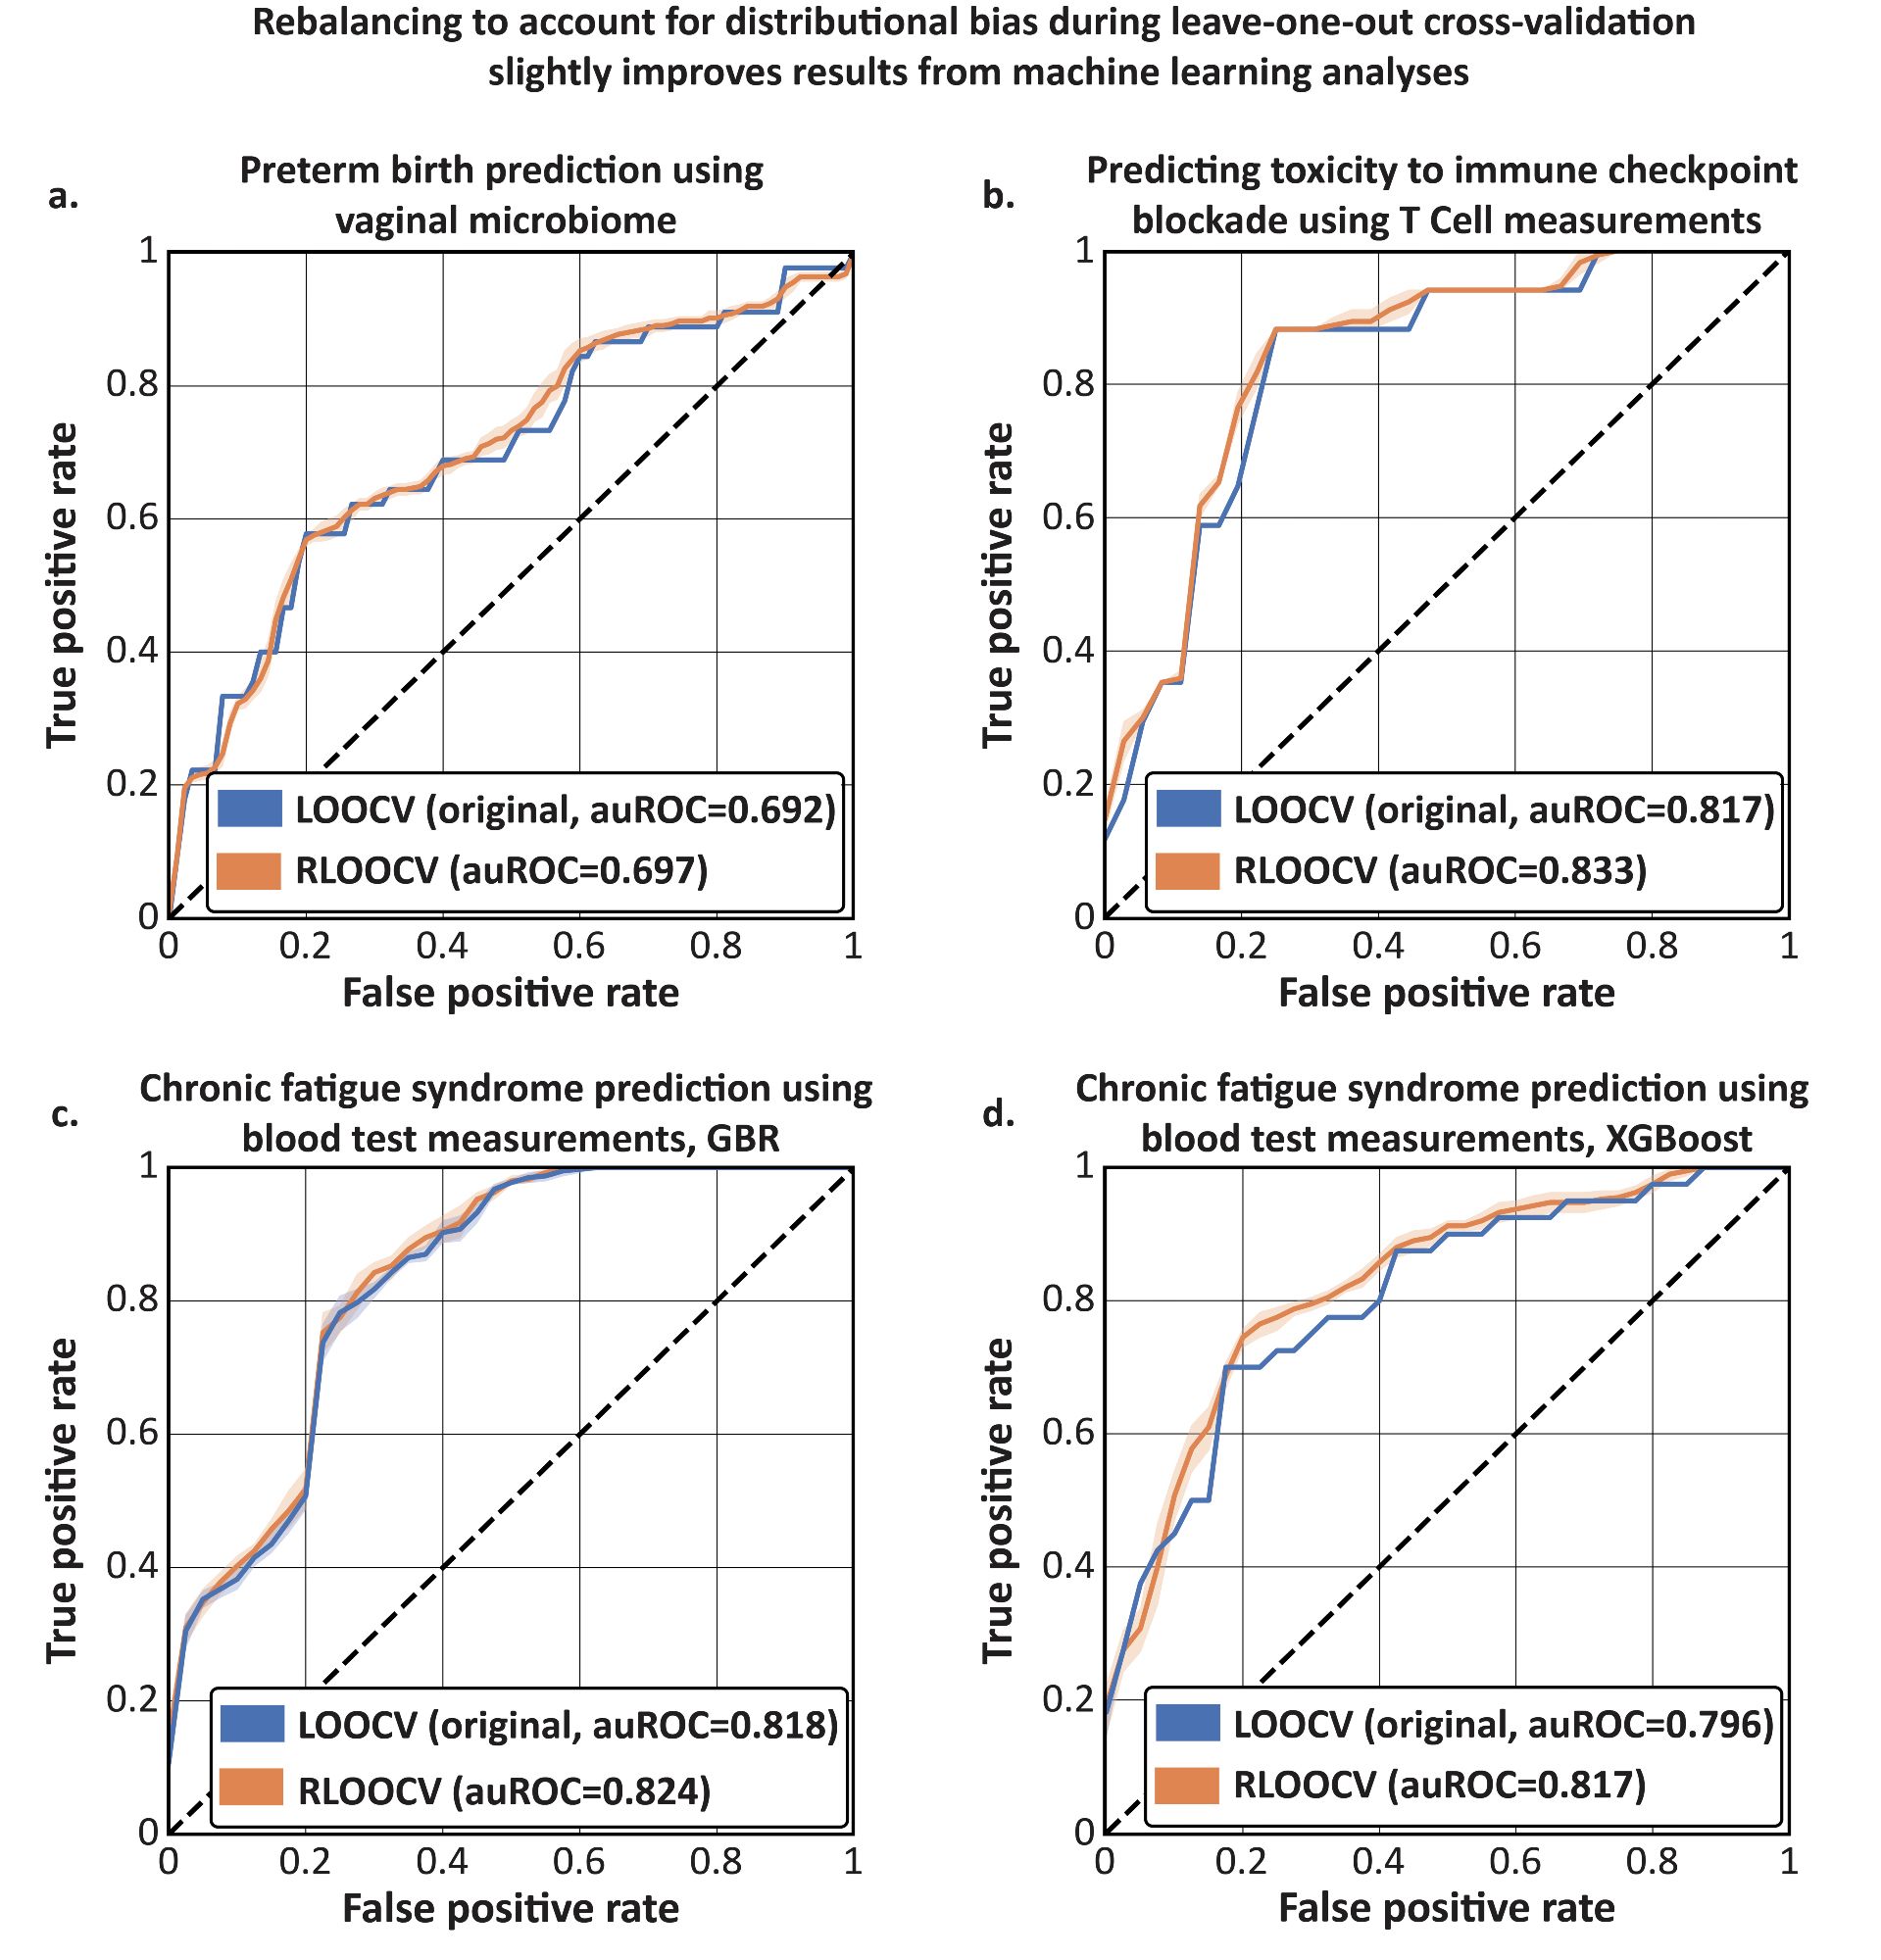
With RebalancedCV we could see the "real-life" impact of distributional bias. We reproduced 3 recently published analyses that used LOOCV, and showed that it under-evaluated performance in all of them. While the effect isn't major, it is consistent.

A reanalysis of 4 evaluations from 3 recently published studies comparing leave-one-out cross-validation to a Rebalanced version, demonstrating the impact of distributional bias. Panel A shows two ROC curves of preterm birth prediction using vaginal microbiome data. LOOCV has an auROC of 0.692 while Rebalanced LOOCV has auROC=0.697. Panel B is an ROC curve of a model predicting toxicity to immune checkpoint inhibitor blockade using T-Cell measurements. LOOCV has auROC=0.817 while RLOOCV has auROC=0.833. Panel C is an ROC of a gradient boosted regressor model predicting chronic fatigue syndrome using blood test measurement. LOOCV has auROC=0.818 while RLOOCV has auROC=0.824. Panel D is the same analysis with an XGBoost mode. LOOCV has an auROC of 0.796 while RLOOCV has auROC=0.817.
1
TKtkorem.bsky.social

With this in mind, we developed RebalancedCV, an sklearn-compatible package which drops the minimal amount of samples from the training set to maintain the same class balance in the training sets of all folds, thus resolving distributional bias. github.com/korem-lab/Re...

GitHub - korem-lab/RebalancedCV

Contribute to korem-lab/RebalancedCV development by creating an account on GitHub.

1
TKtkorem.bsky.social

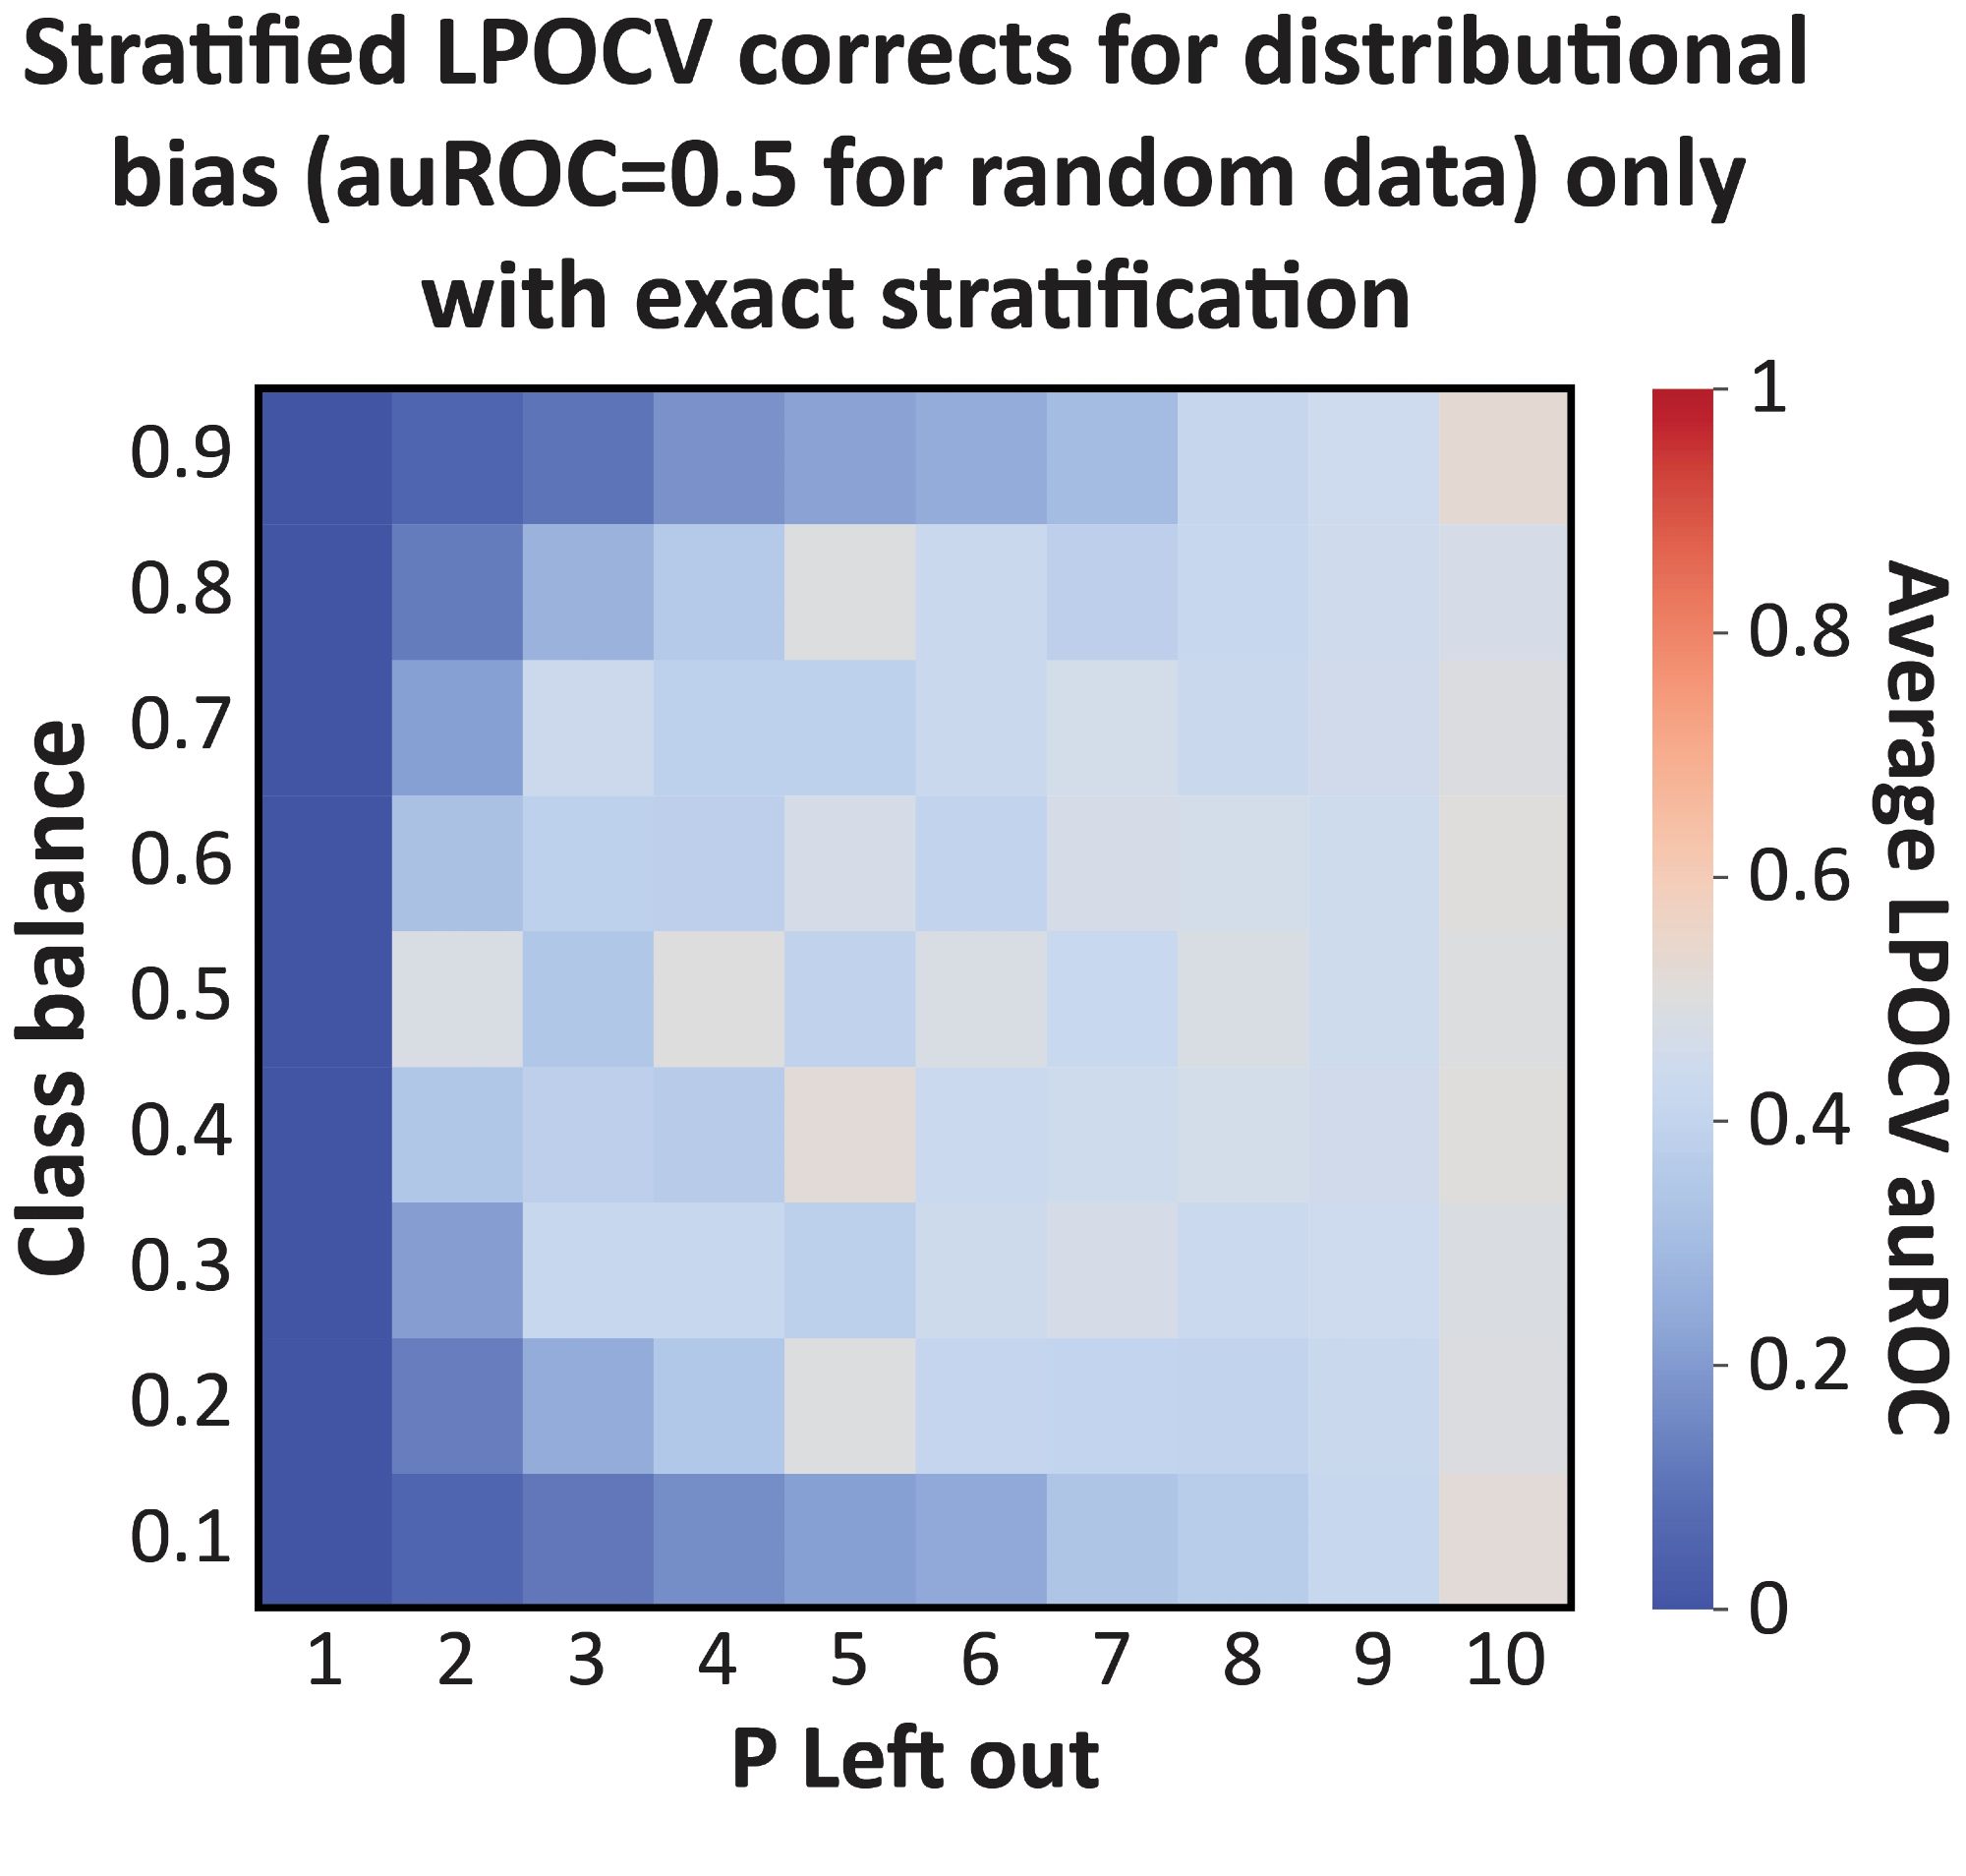
As the issue is caused by a shift in the class balance of the training set, distributional bias can be addressed with stratified CV - but only if your dataset allows it to happen precisely. The less exact the stratification - the more bias you have (in this plot, closer to 0).

A heatmap showing the average auROC under stratified leave-P-out cross-validation. The x-axis shows P from 1-10, and the y-axis shows class balances ranging from 0.1 to 0.9. The heatmap shows that stratification corrects for distributional bias (i.e., has an auROC of 0.5 for random data) only when exact stratification is possible. For example, with leave-1-out cross-validation, an exact stratification is never possible, and the auROC=0 for all class balances. For leave-10-out CV exact stratification is always possible for the class balances tested, so the auROC is always close to 0.5. For leave-5-out cross-validation, however, exact stratification is possible only for some class balances. For class balances of 0.2, 0.4, 0.6, 0.8, the auROC is 0.5, For the rest, it is significantly lower than 0.5.
1
TKtkorem.bsky.social

Does this mean that past work with LOOCV is overinflated? Not quite. Most machine learning algorithms regress to the mean - not to its negative - and so they are actually _under_evaluated. That's the negative bias we started with!

1
TKtkorem.bsky.social

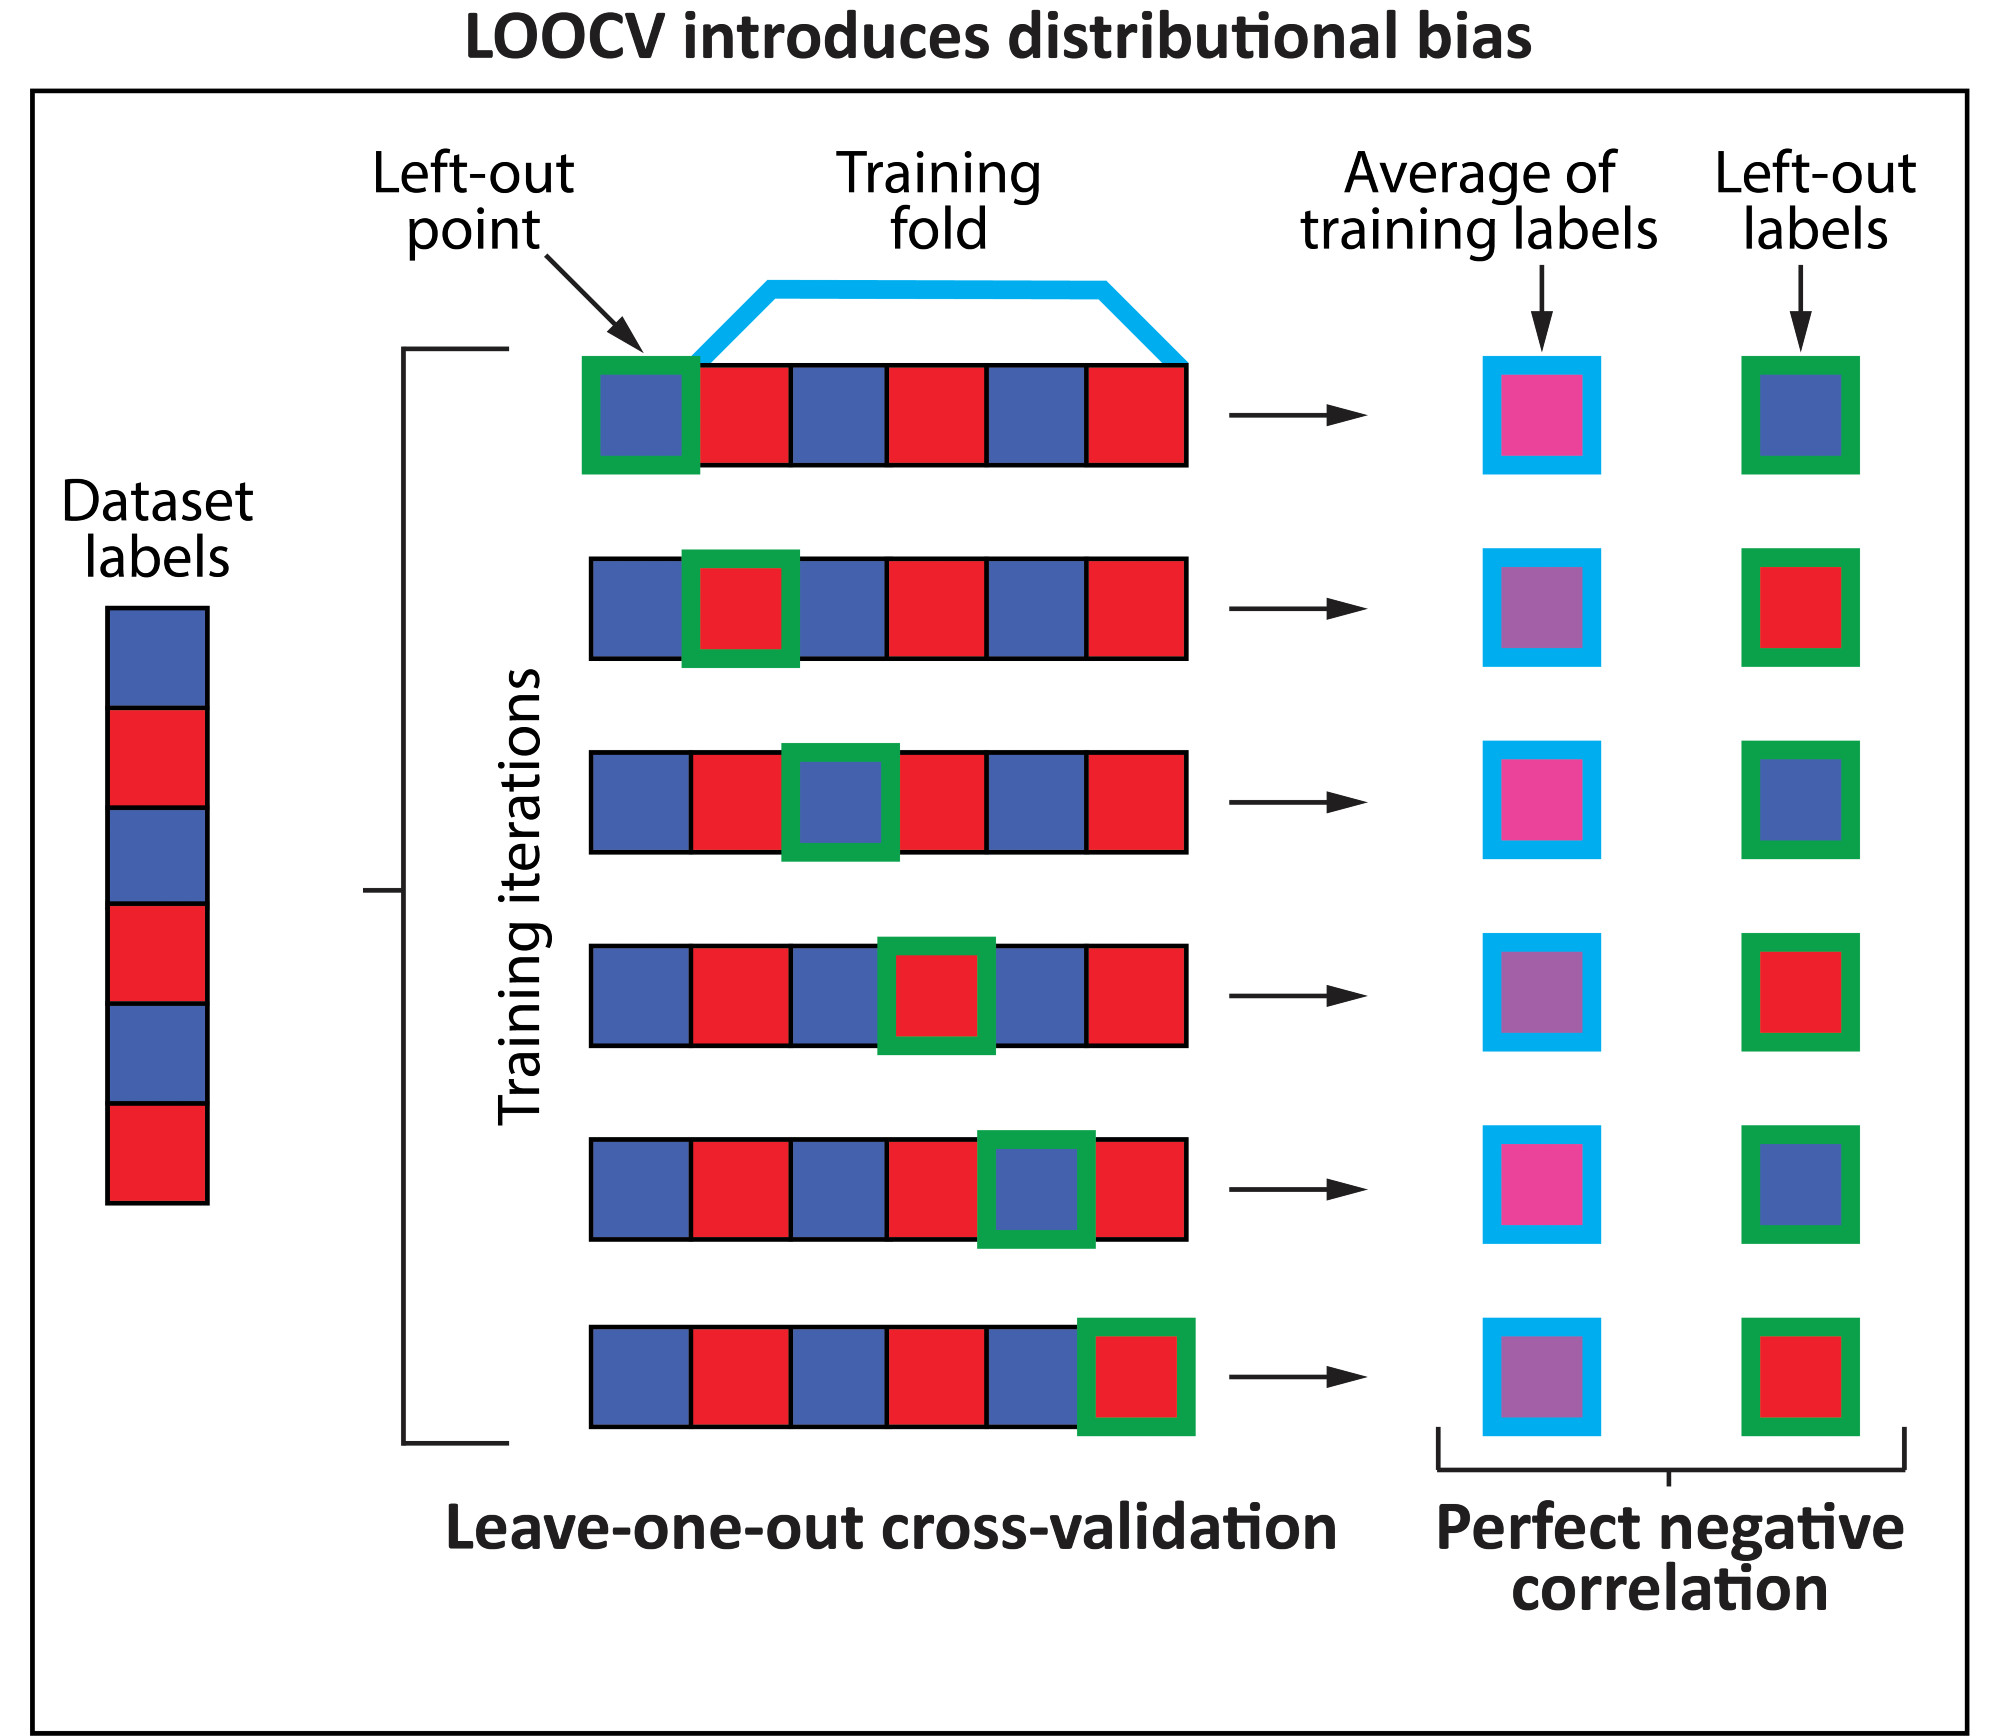
Distributional bias is a severe information leakage - so severe that we designed a dummy model that can achieve perfect auROC/auPR in ANY binary classification task evaluated via LOOCV (even without features). How? it just outputs the negative mean of the training set labels!

A receiver operating characteristic curve of a dummy predictor always providing a score equals to the negative of the average of the training set's labels. The curve goes from 0,0 to 0,1 to 1,1, having an area under the curve of 1.
1
TKtkorem.bsky.social

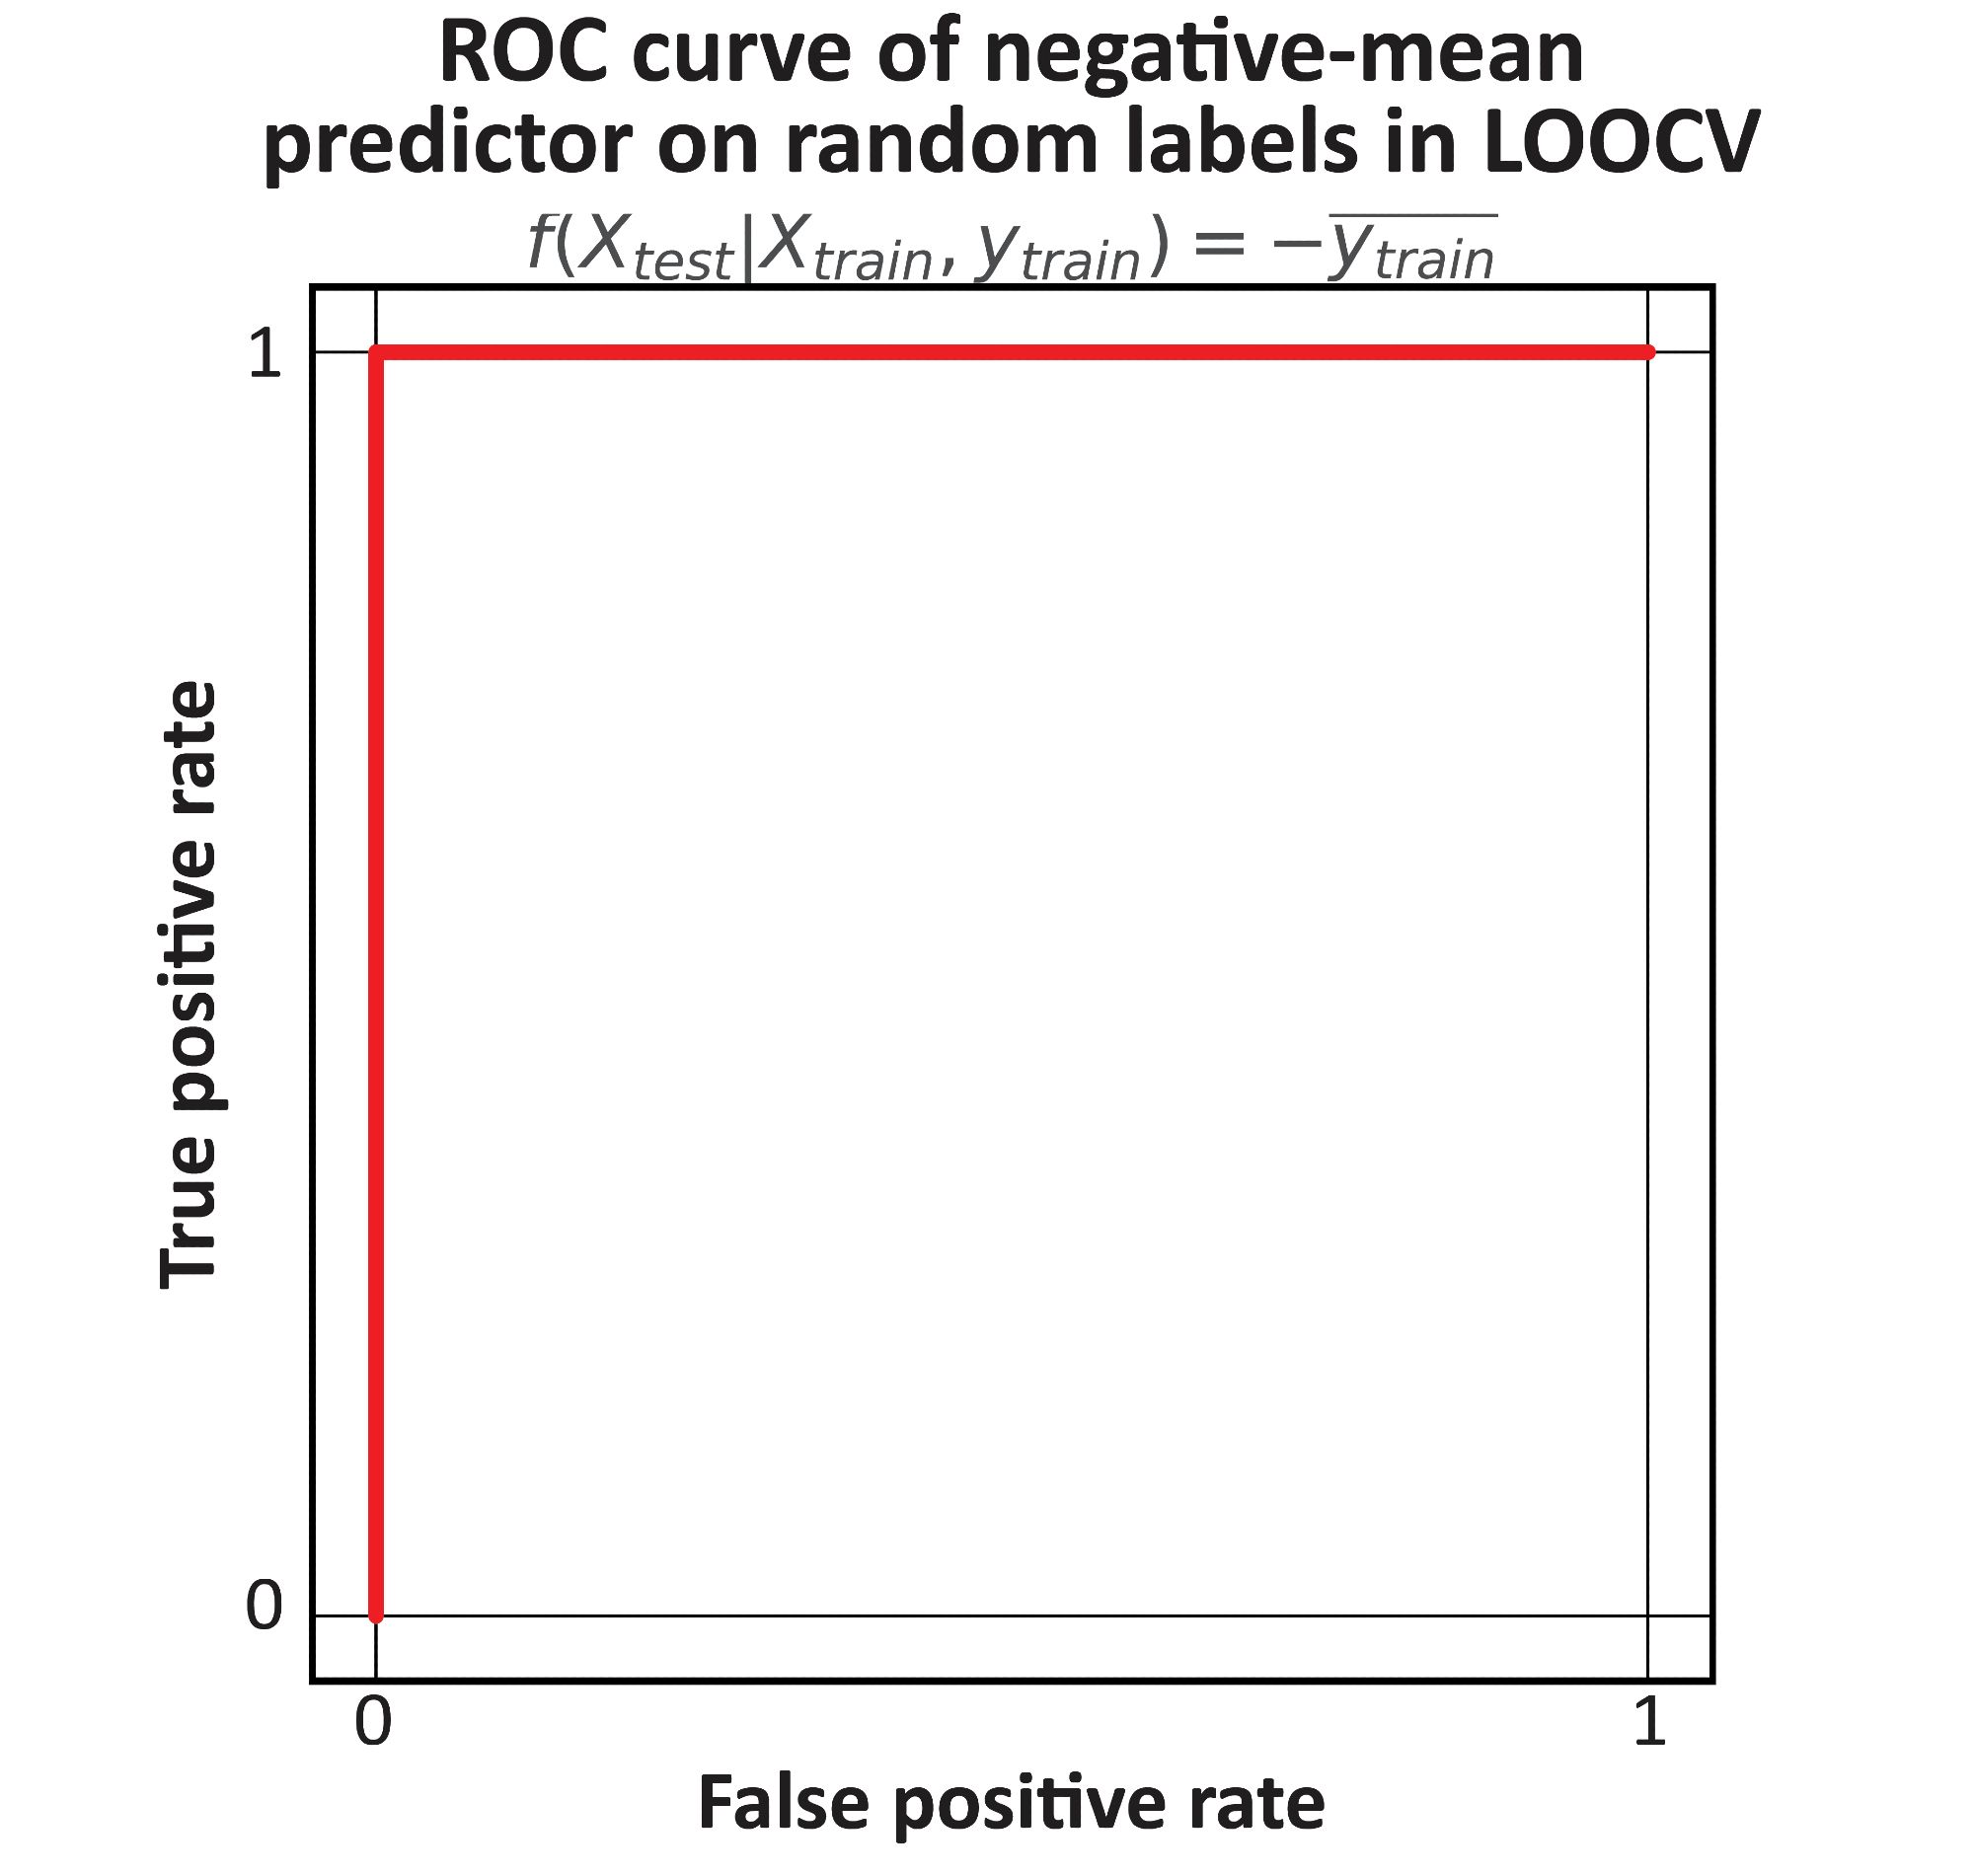
The issue is that every time one holds out a sample as a test set in LOOCV, the mean label average of the training set shifts slightly, creating a perfect negative correlation across the folds between that mean and the test labels. We call this phenomenon distributional bias:

An illustration of how leave-one-out cross-validation introduces distributional bias. On the left are N data set labels. In each training iteration, one sample is held out as a test set. When that sample has a positive label, it shifts the average of the training set's labels down. When that sample has a negative label, it shifts the average of the training set's labels up. This creates a perfect negative correlation across the training iteration of the average of the training set's labels and the held out data points.
1
TK
Tal Korem
@tkorem.bsky.social
Microbiome, network inference, metabolism and reproductive health. All views are mine.
239 followers159 following51 posts