KV
Koen Van den Eeckhout
@vandeneeckhoutkoen.bsky.social
📊 Turning complex data into powerful visual stories!
Author of 'Powerful Charts'. Ex-physicist. He/him 🏳️🌈
462 followers34 following76 posts
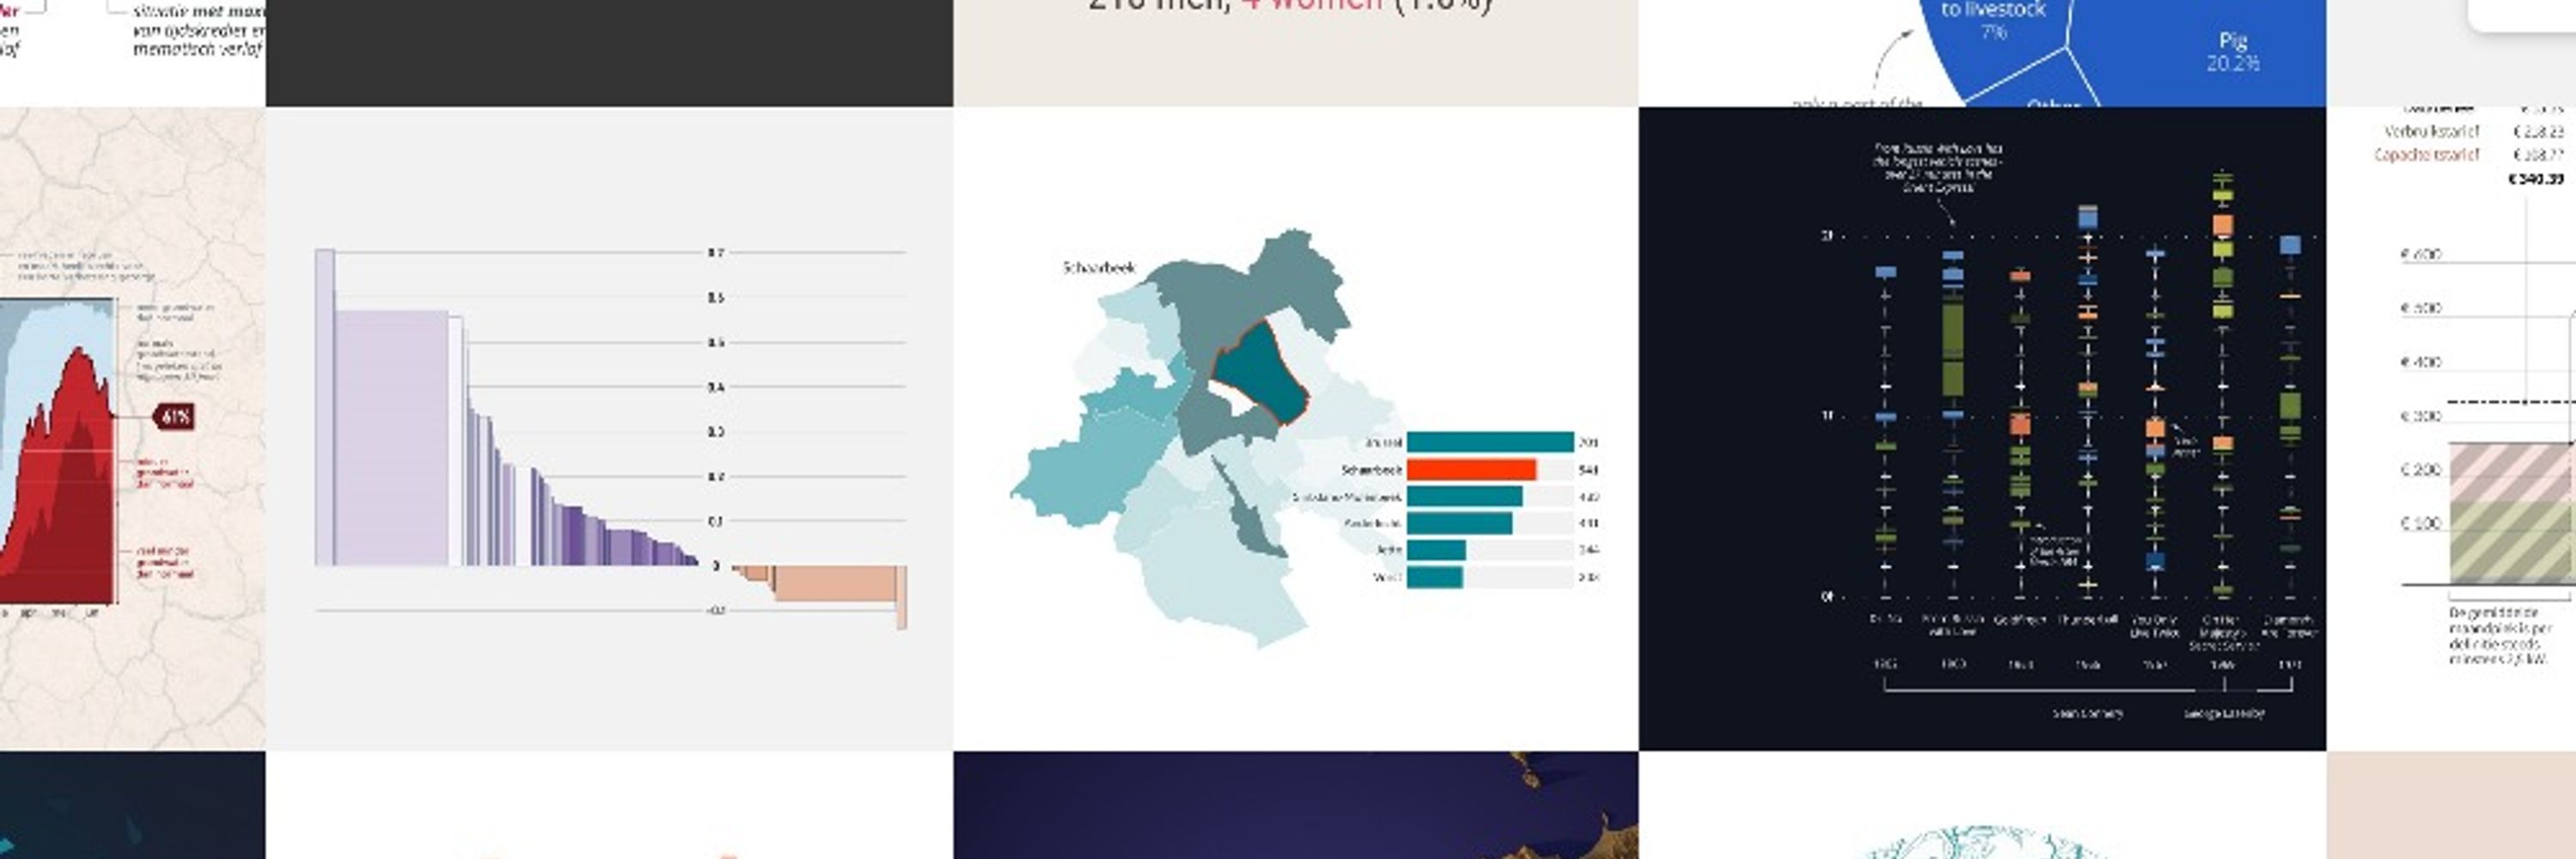
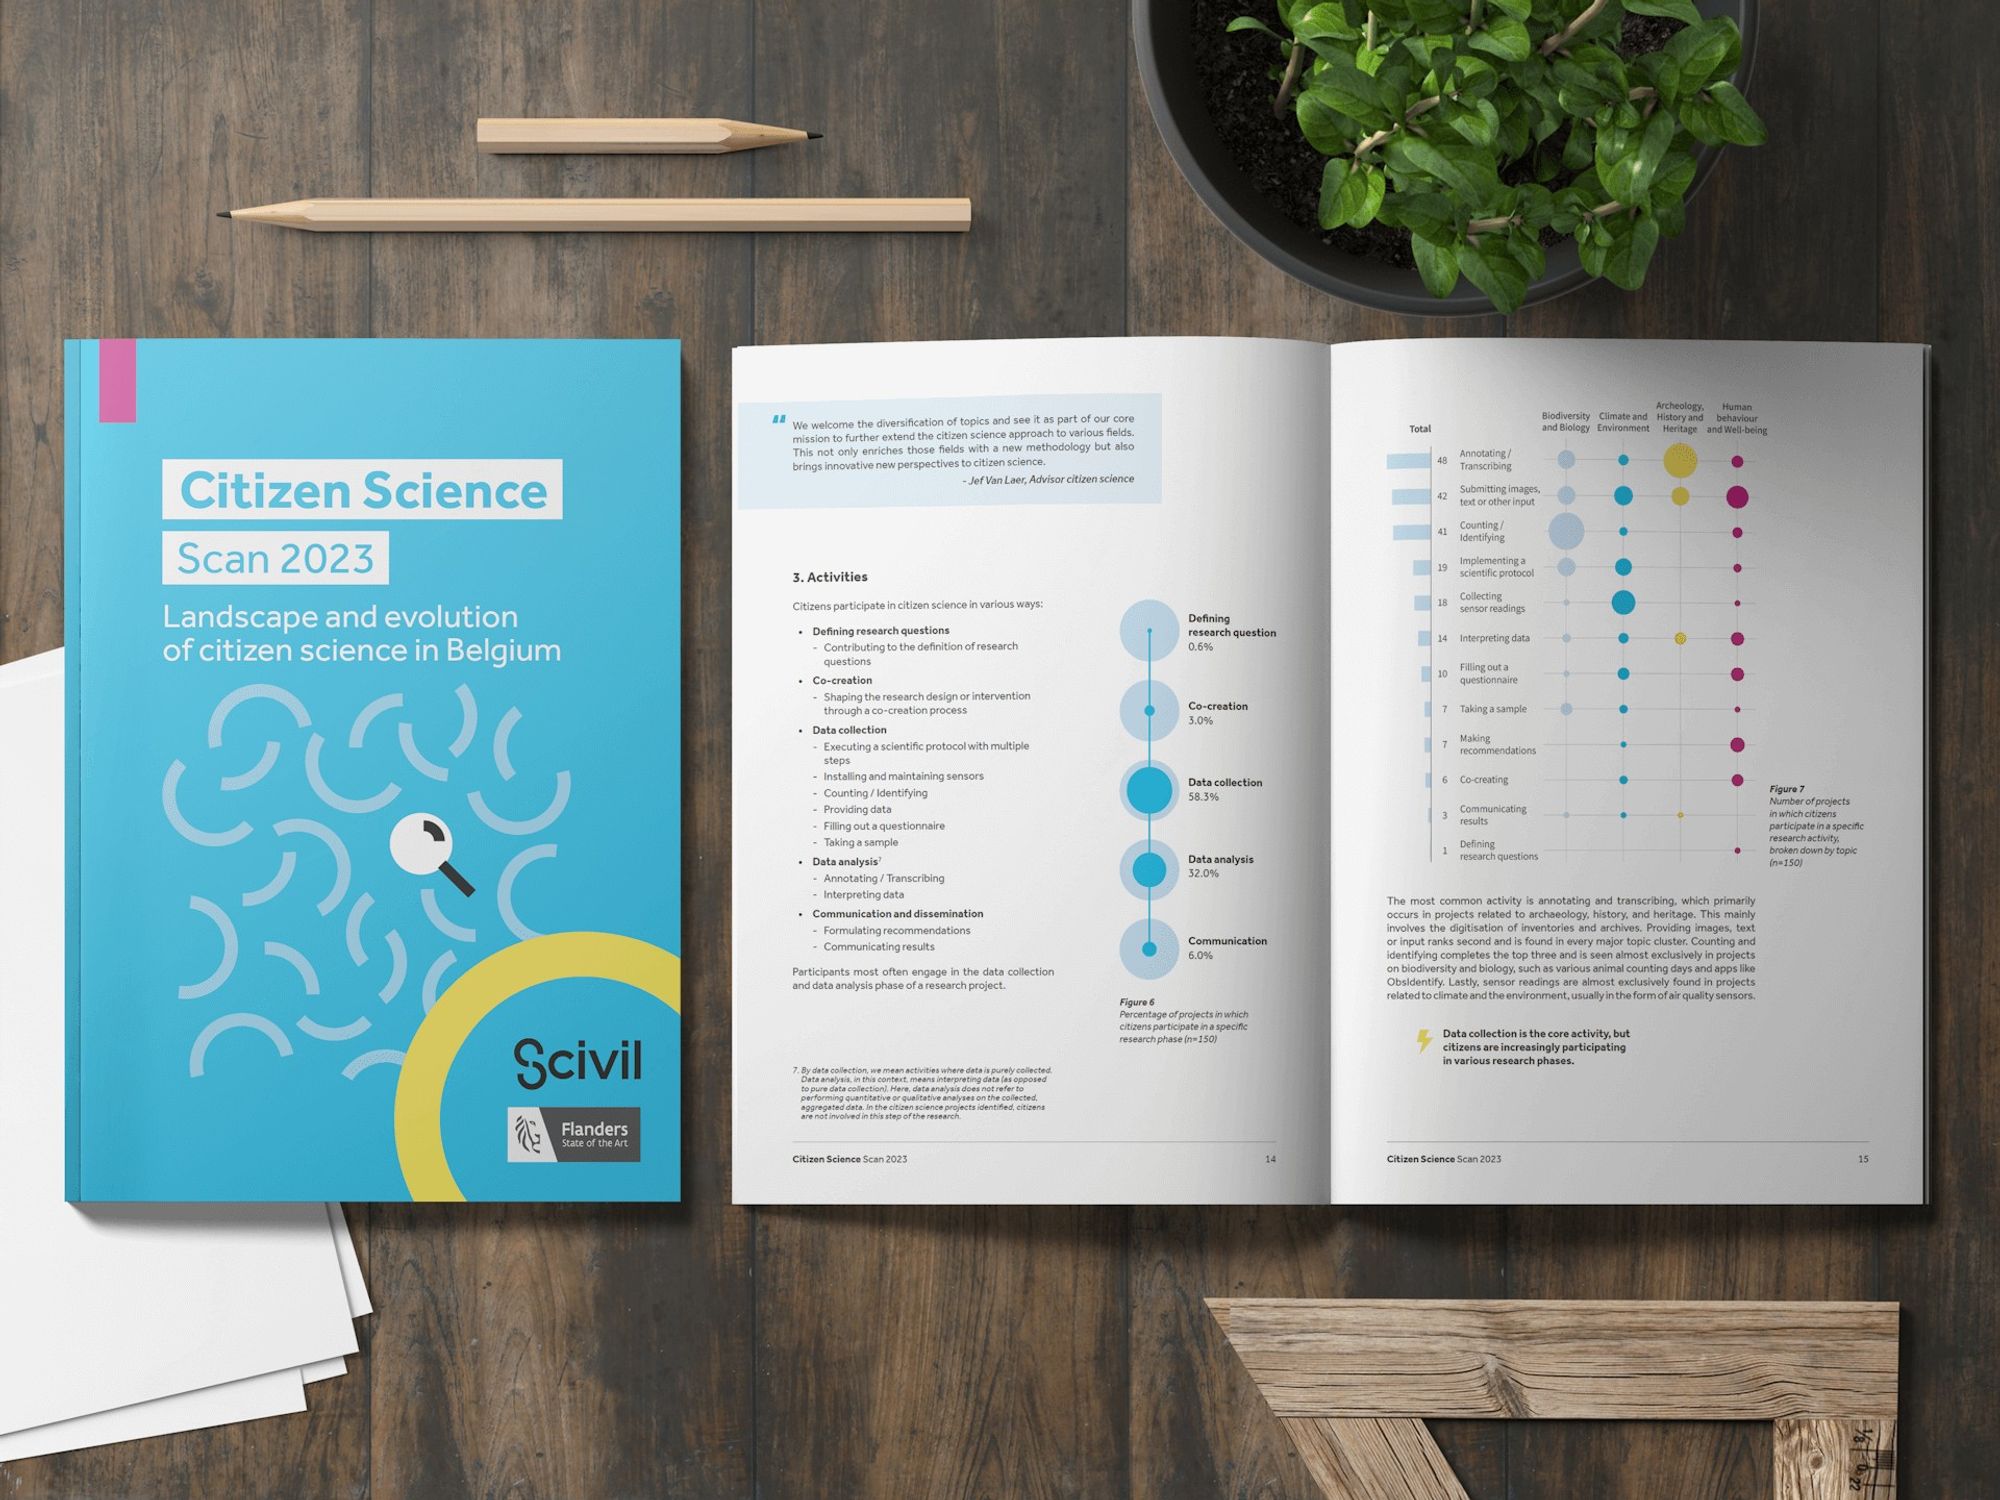
Yours truly had the honour of creating the layout ánd the charts for the report. And here are some of my favourites! 🥰 Voronoi chart, matrix chart, half-a-donut chart, and... a nipple chart? #reportdesign#informationdesign#dataviz (2/13)
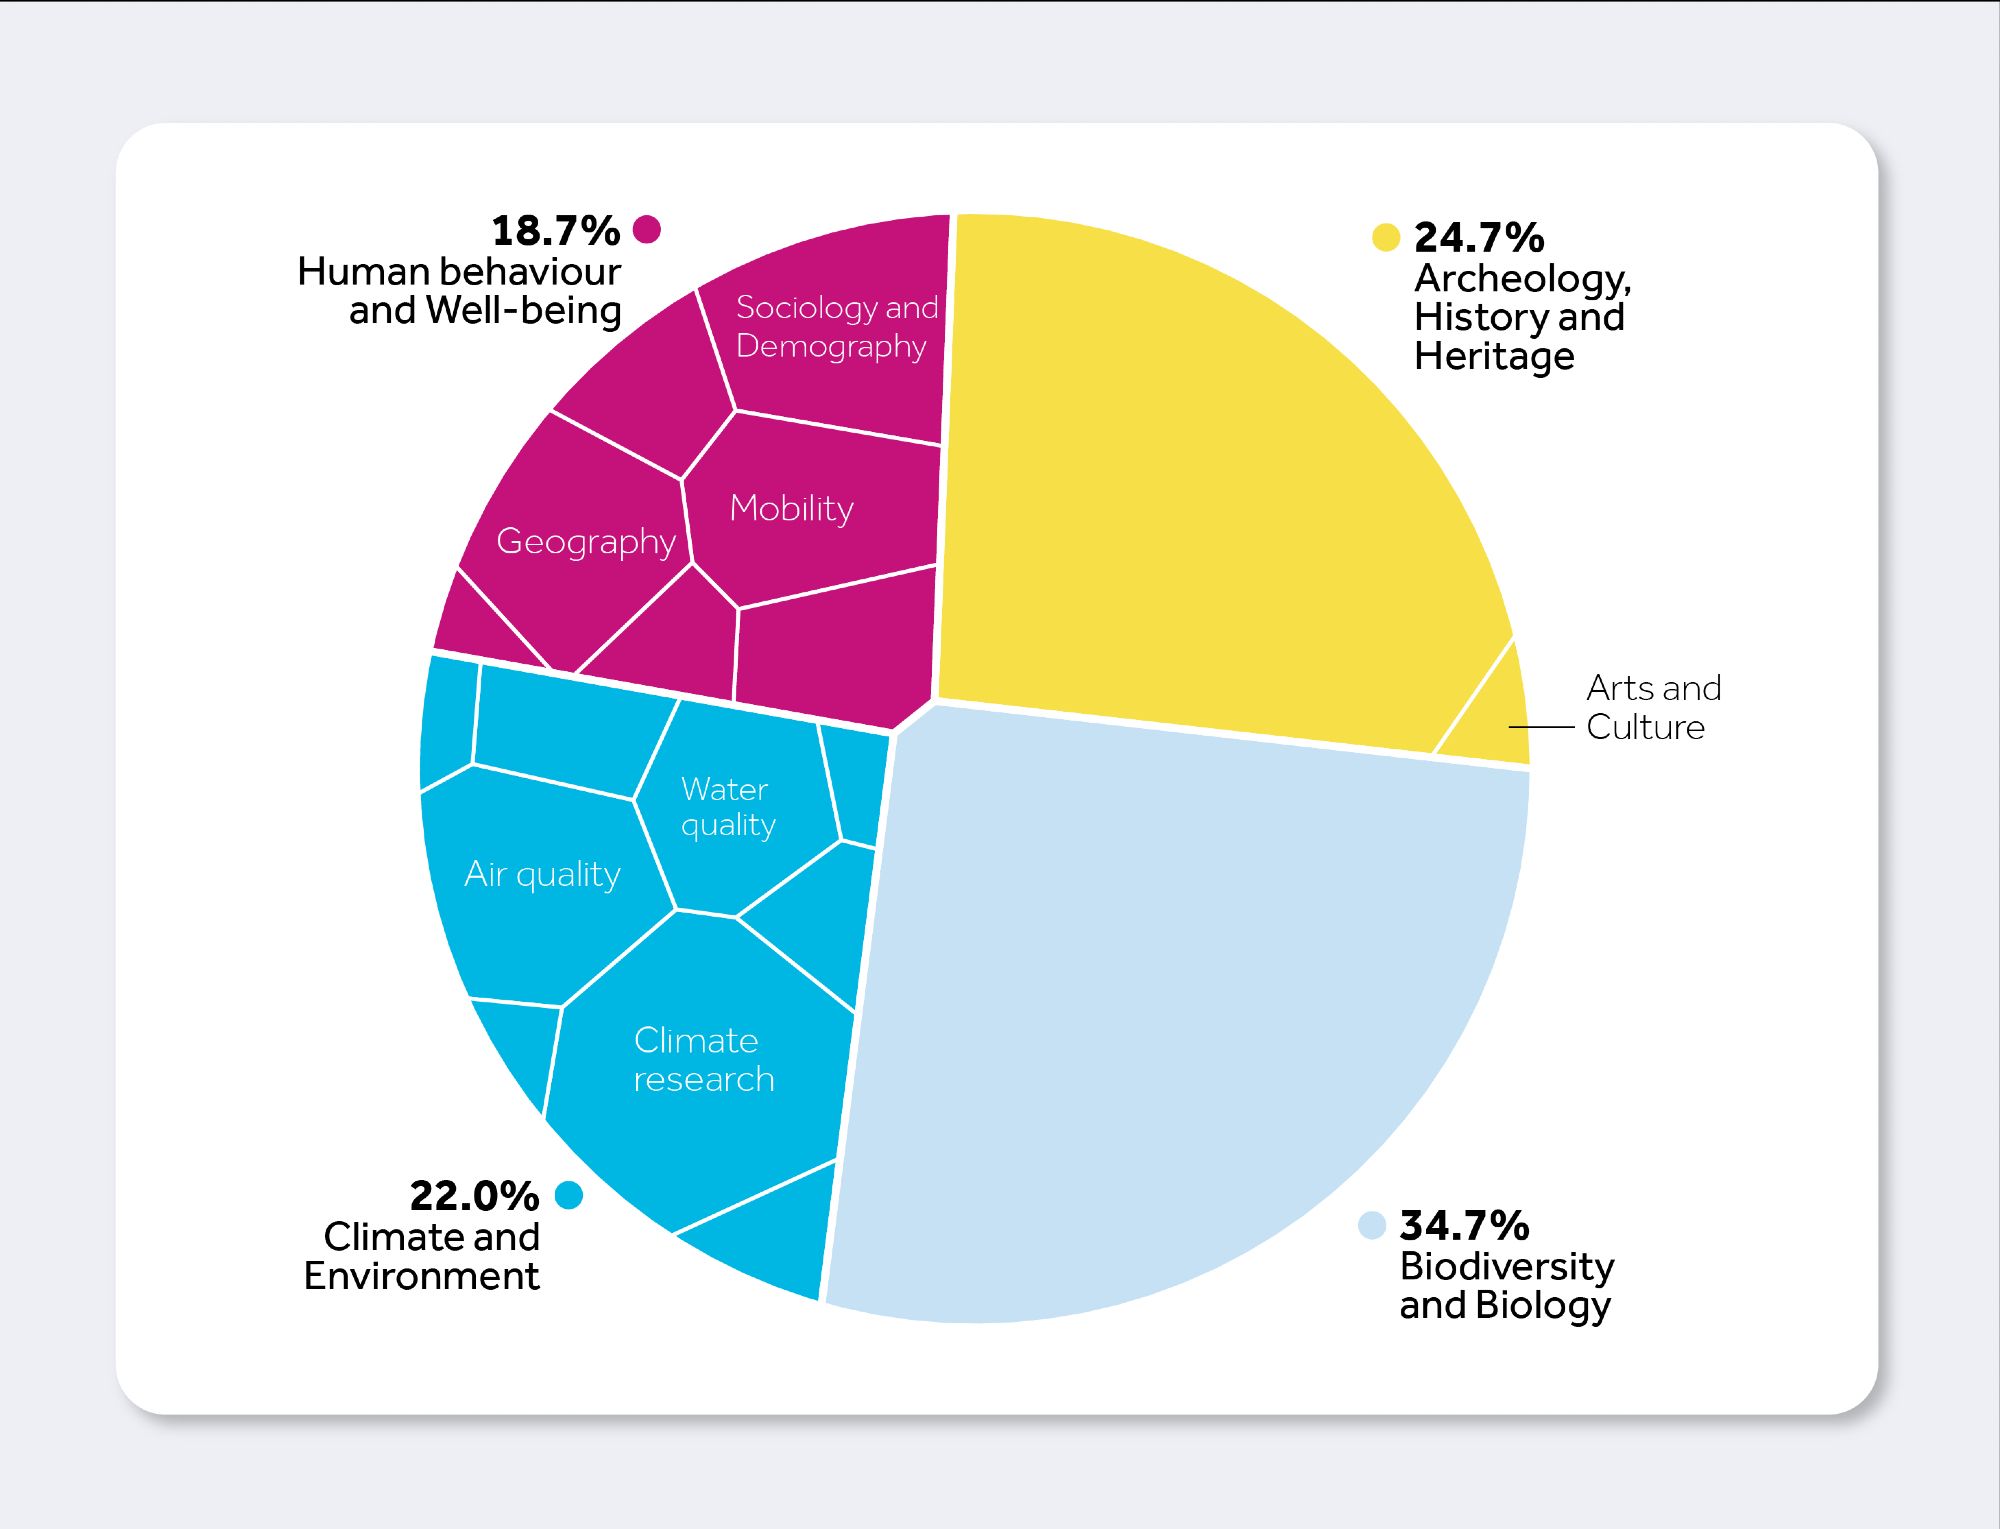
This Voronoi chart shows to which topics the different Citizen Science projects belong. It’s a great alternative for a more simple treemap, and its circular shape makes it stand out! (3/13)
KV
Koen Van den Eeckhout
@vandeneeckhoutkoen.bsky.social
📊 Turning complex data into powerful visual stories!
Author of 'Powerful Charts'. Ex-physicist. He/him 🏳️🌈
462 followers34 following76 posts