#30DayChartChallenge#30DayGenerativeArtChallenge#InformationDesign#GenerativeArt
More information on Charlotte's (and her collaborator, Rebecca Smith of Urban Projections) work here: www.thetuppermuseum.com/exhibitions/...#art#informationdesign#maps#environment
Stay tuned for more editions of Insight Out featuring participatory data visualisations from this cubical installation! #datavisualization#dataviz#datavisualisation#informationdesign#data#design#charts

In two months, it will be November 16, the day after CEST-LA-VIZ. Make sure you don’t wake up then and realize you forgot to register. cest-la-viz.nl#dataviz#datavisualisation#informationdesign
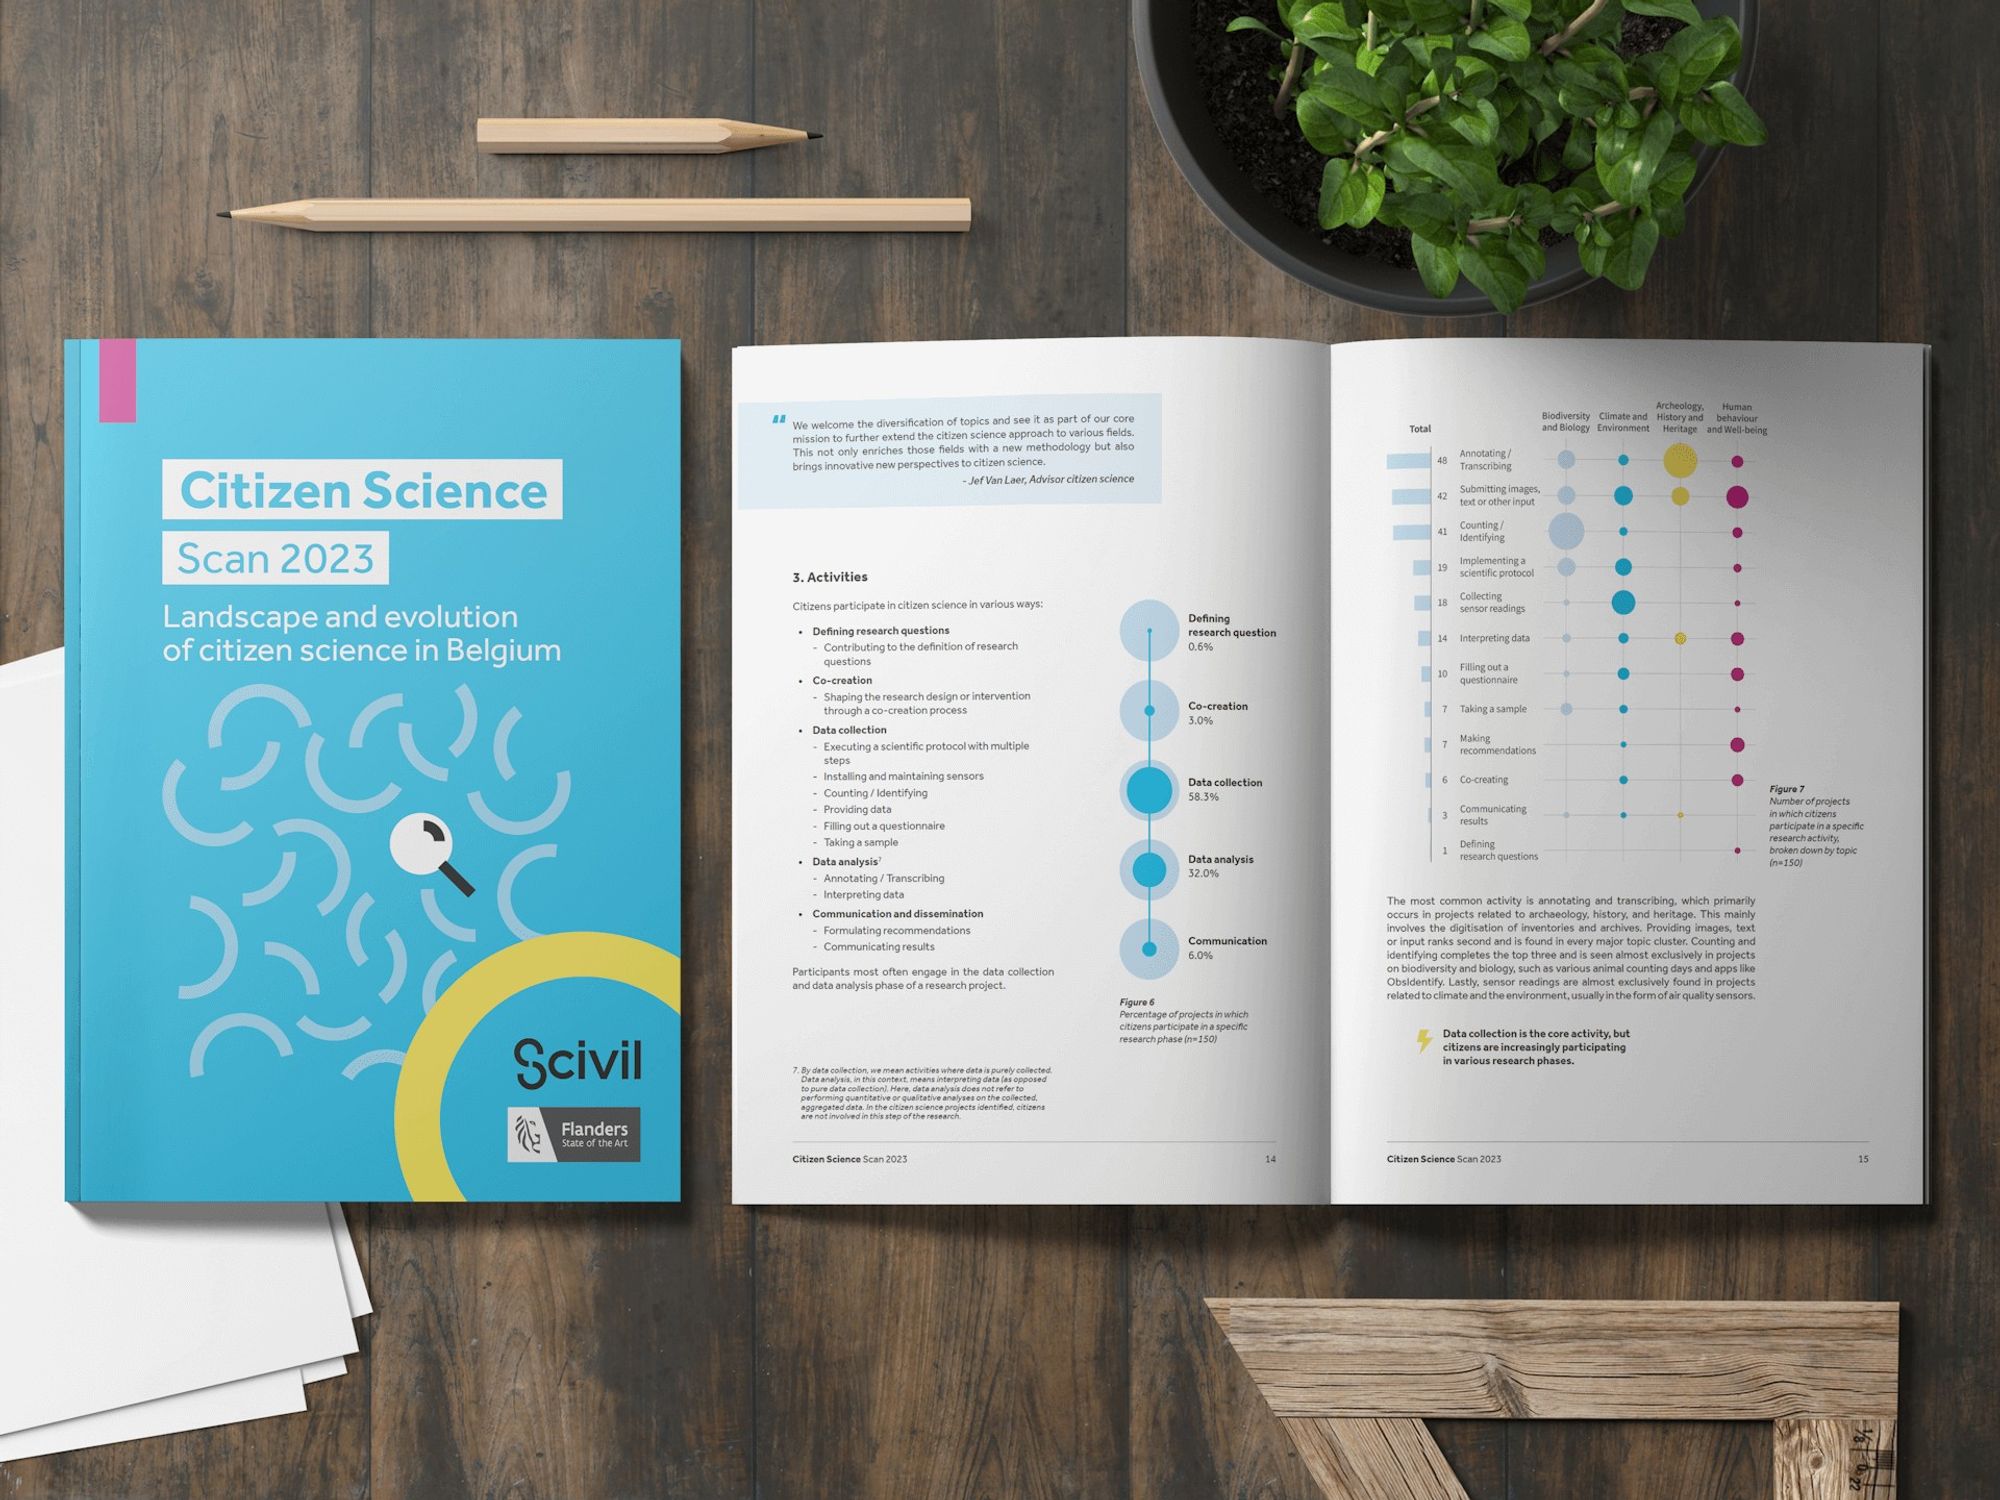
Yours truly had the honour of creating the layout ánd the charts for the report. And here are some of my favourites! 🥰 Voronoi chart, matrix chart, half-a-donut chart, and... a nipple chart? #reportdesign#informationdesign#dataviz (2/13)
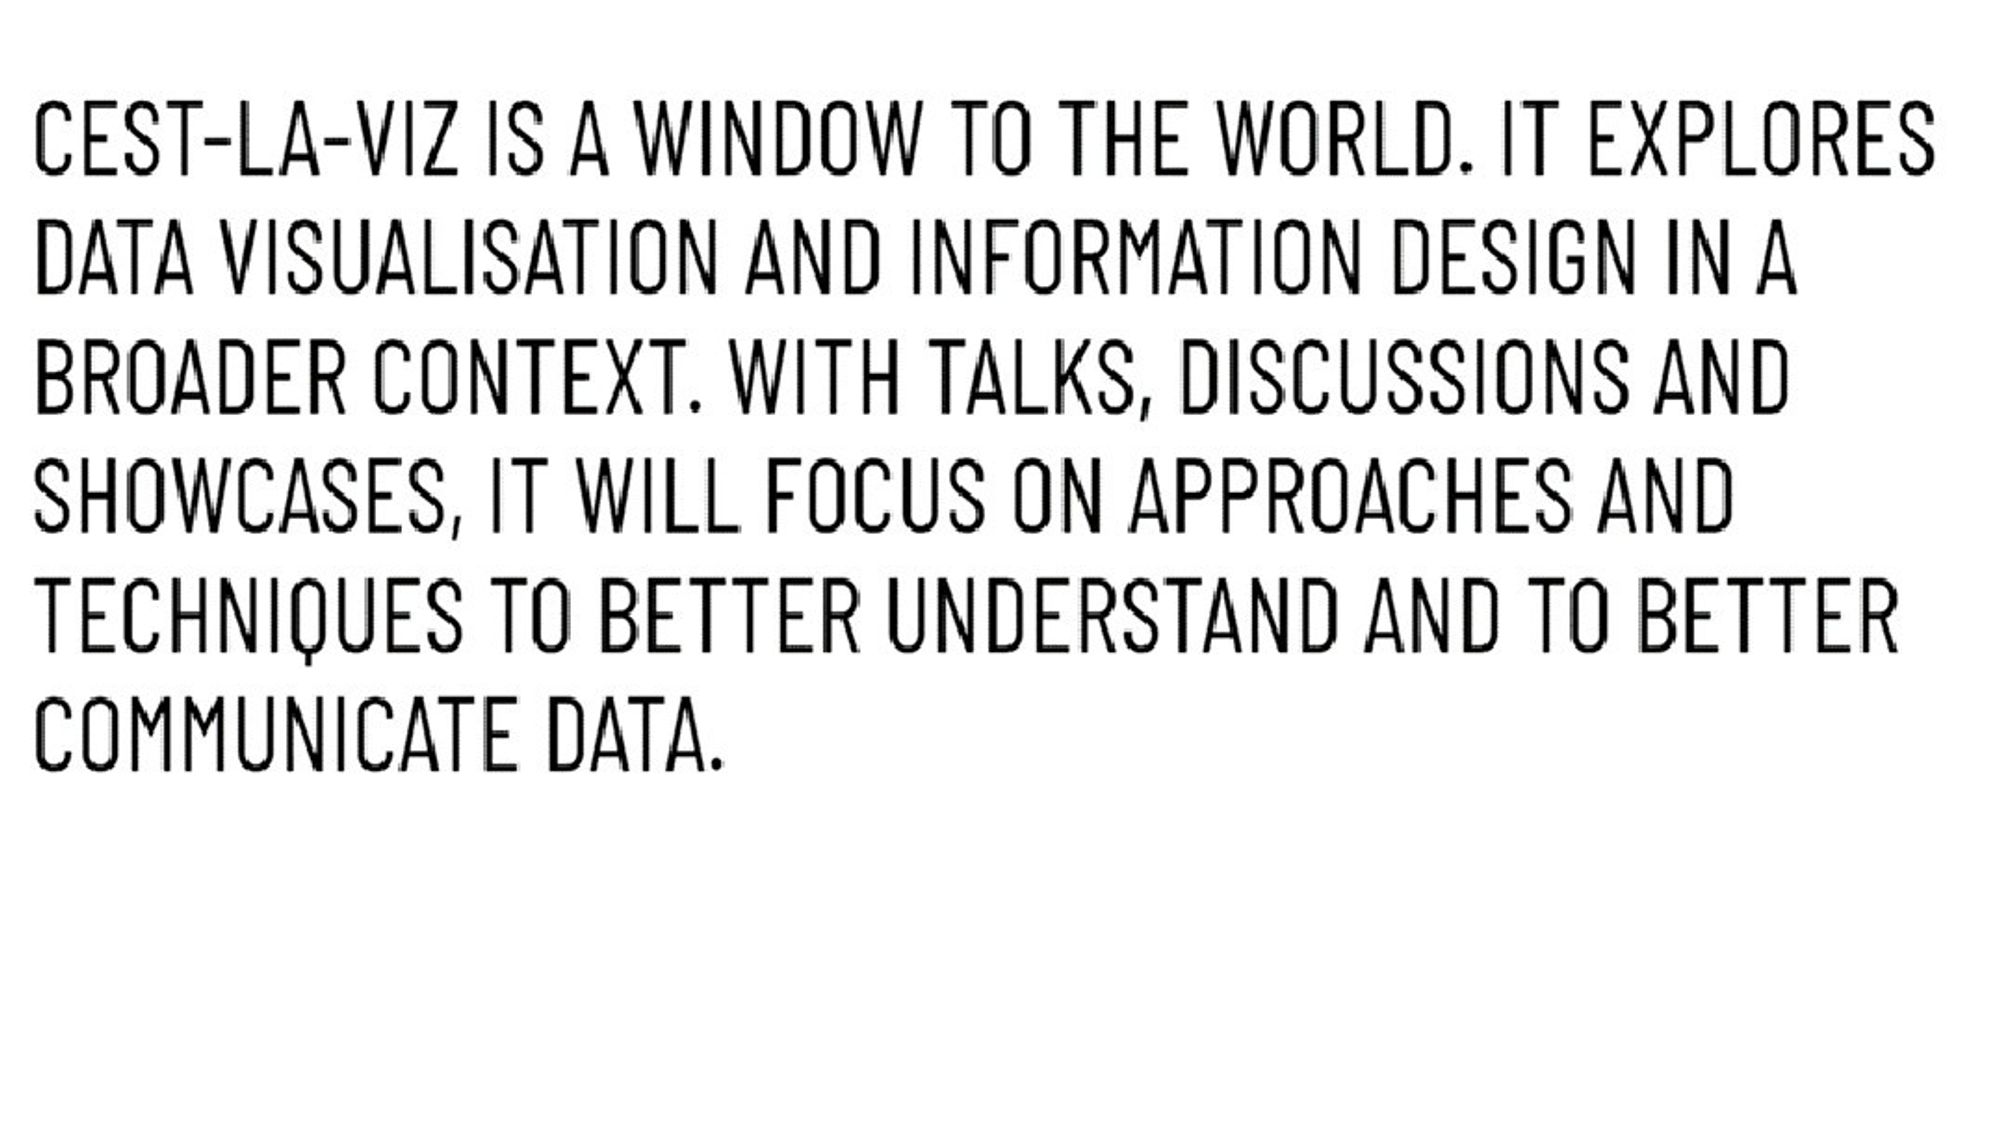
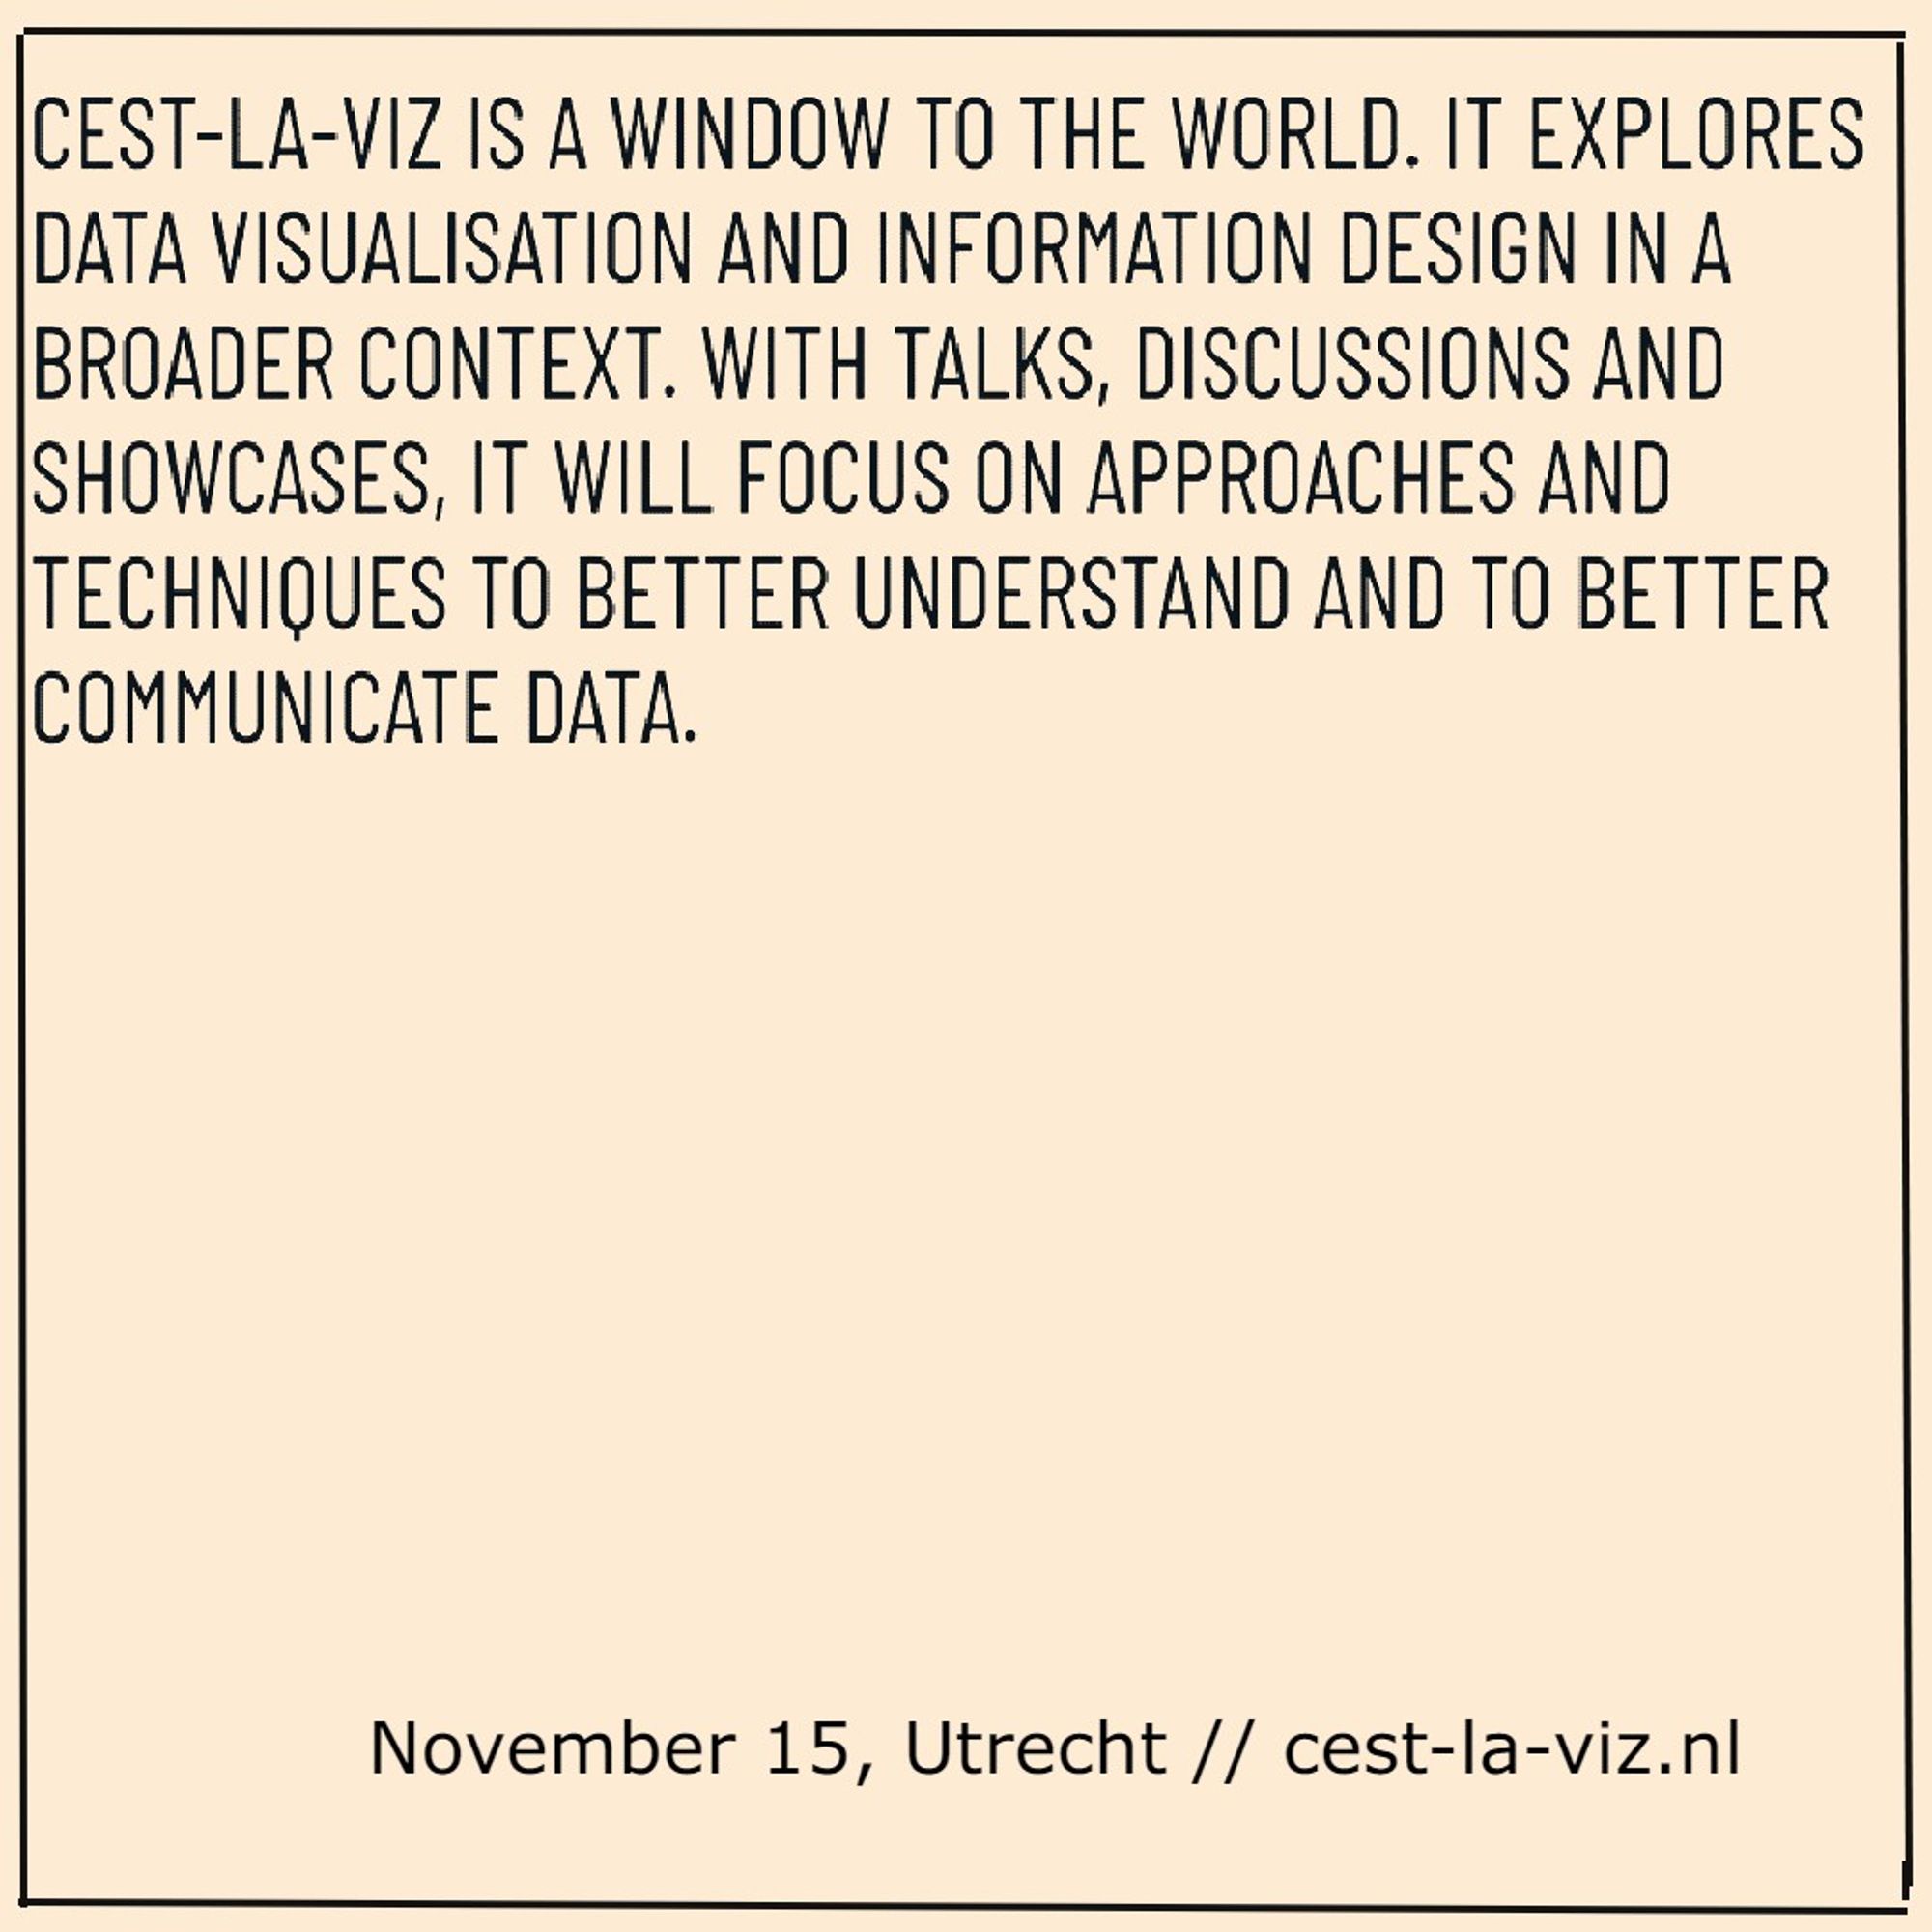
CEST-LA-VIZ is a window to the world. With talks, discussions and showcases, it will focus on approaches & techniques to better understand and communicate data. Join us on November 15 in Utrecht (the Netherlands) for a full day of inspiration. cest-la-viz.nl#dataviz#informationdesign
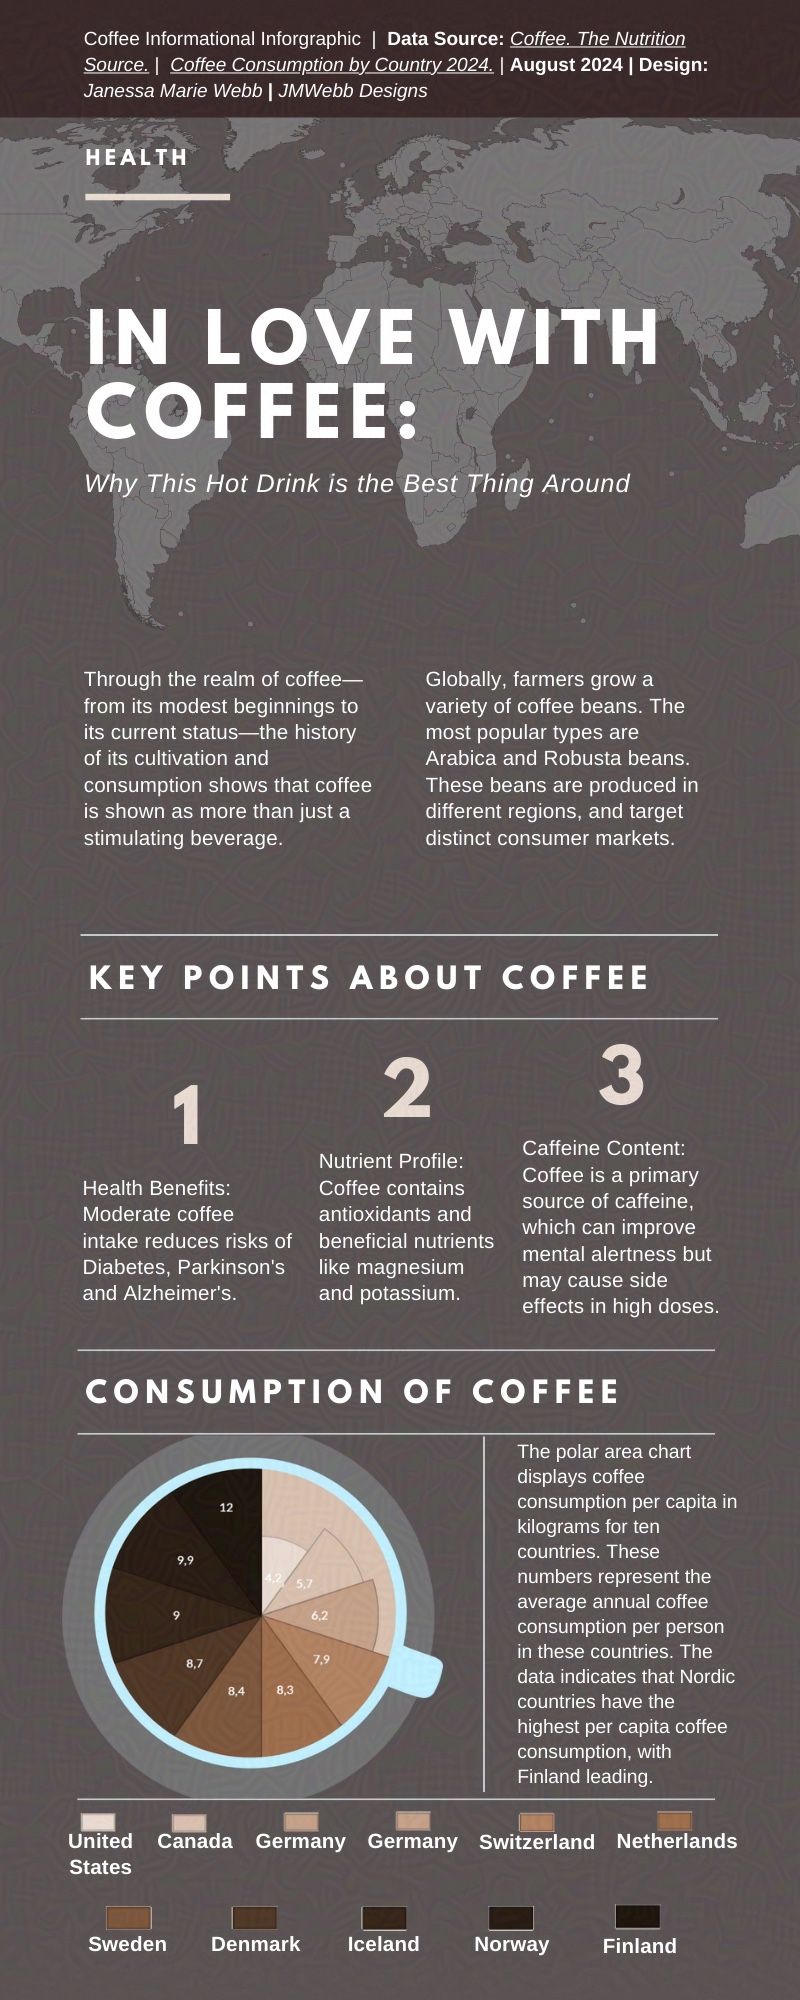
This informatioal infographic is about the coffee’s journey from humble beginings to a global scale. The graphic also highlights diverse beans like Arabica and Robusta. It even emphasizes the coffee’s rich taste and aroma. . . . #infographic#datavisualization#informationdesign#graphicdesign
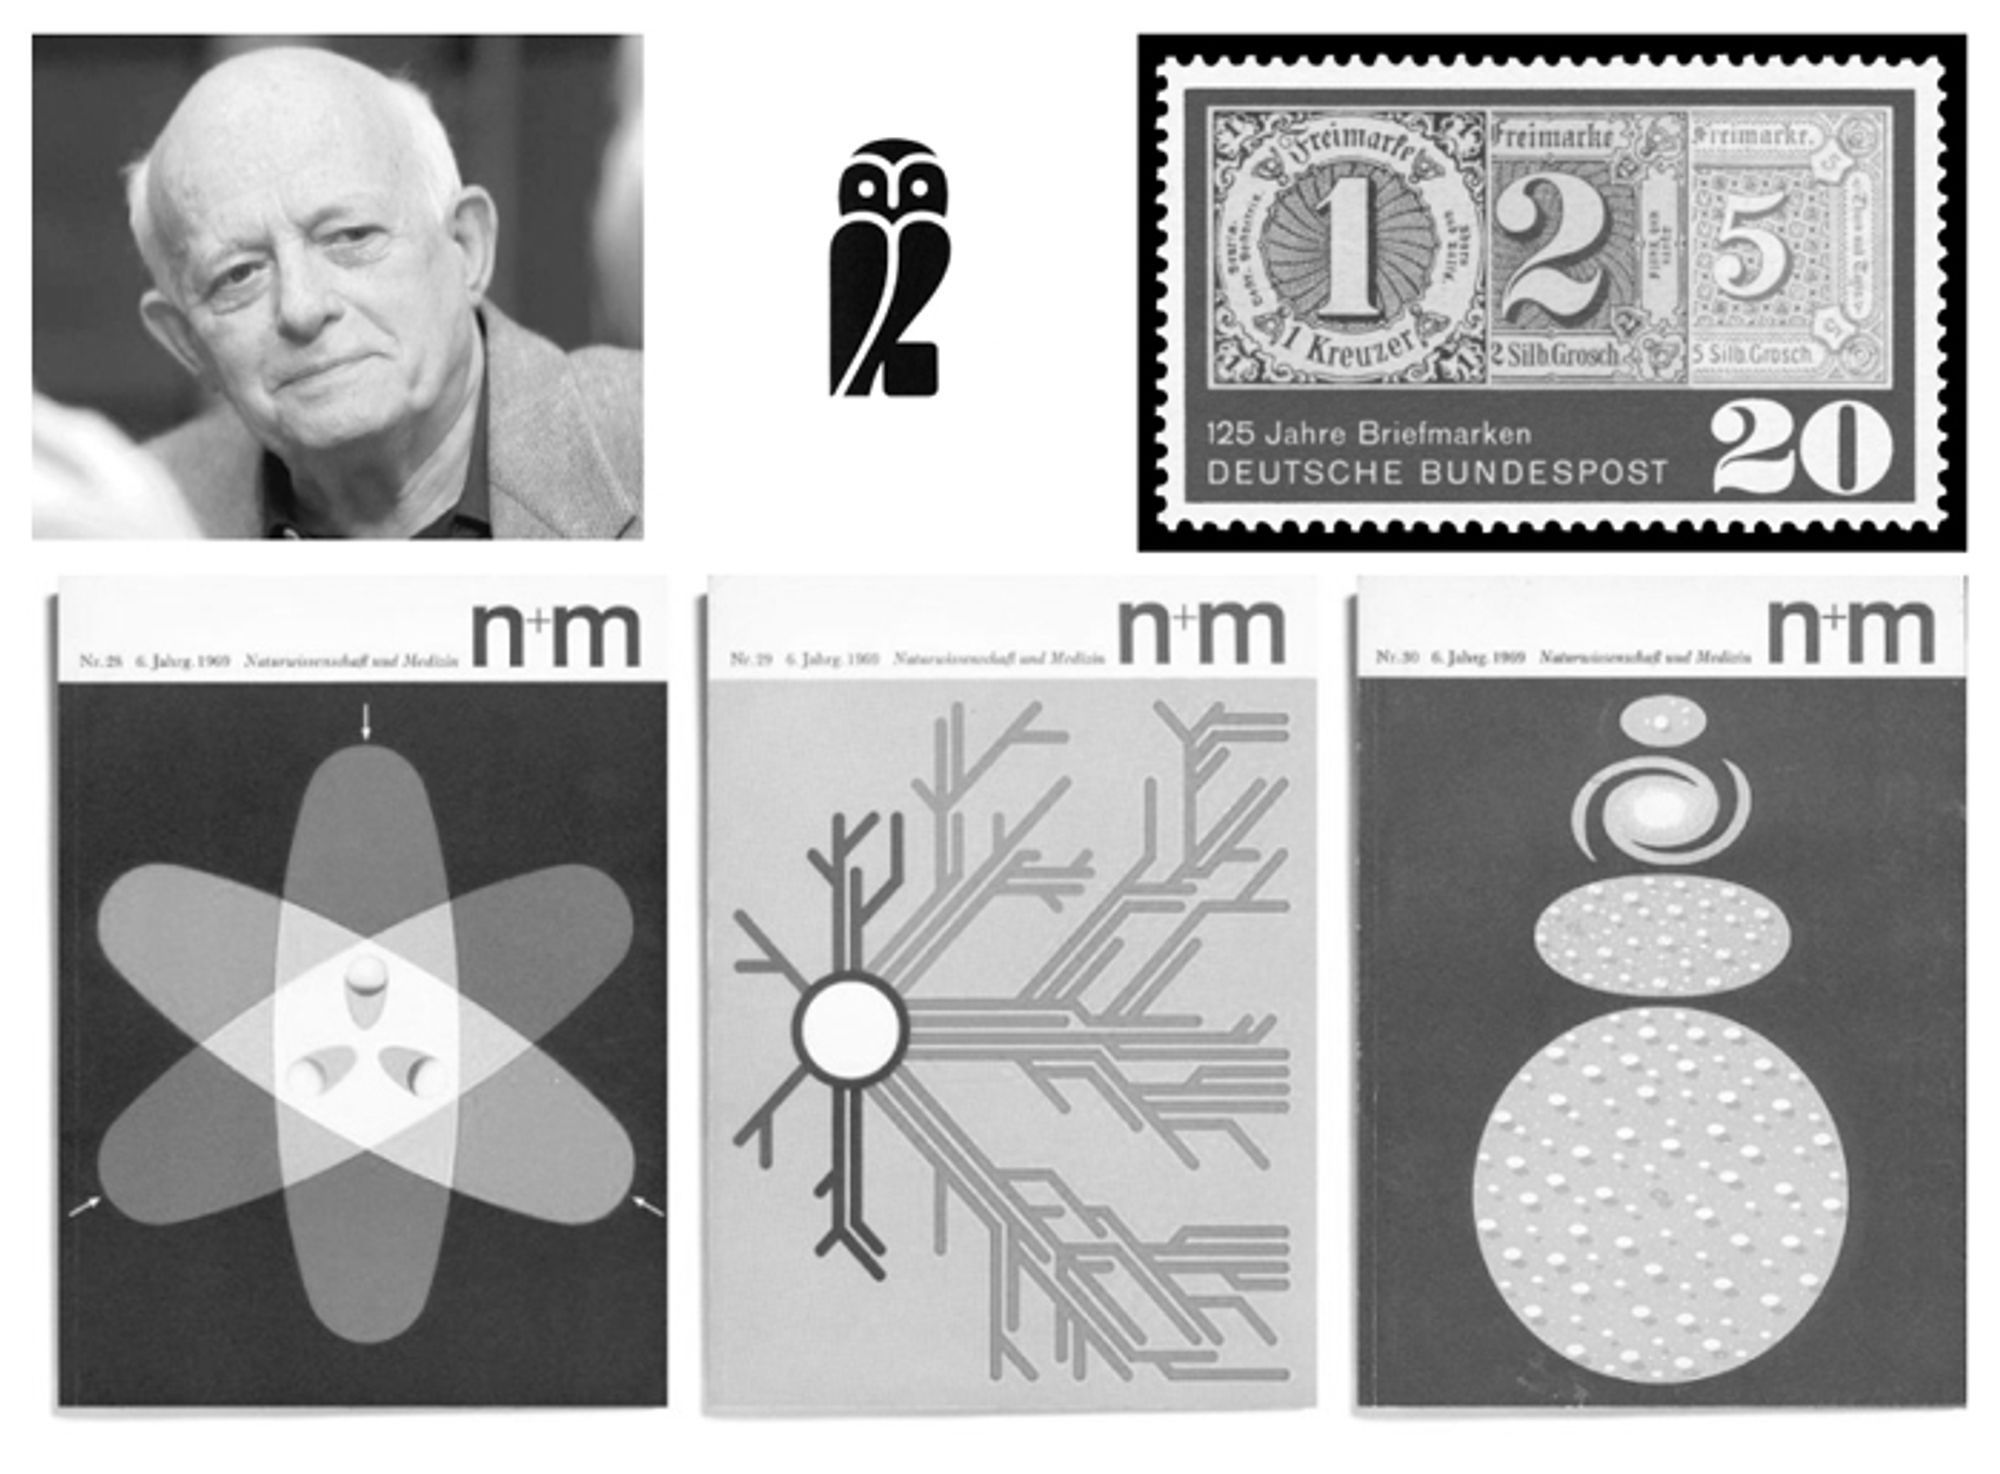
Happy birthday Erwin Poell. The prolific graphic, type & book designer, famous for postage stamp & book designs as well as information design for scientific journals, was born today in 1930. #informationdesign
Who would you include on an abridged history of #DataVisualization#InformationDesign to give a broad overview to learners? Already have Priestly, Playfair, Minard, Willard, Snow, Nightingale, Du Bois, Briton, Neurath and Modley included. Any one else?